Monitoring
TIBCO Control Plane uses the Monitor Agent to monitor data planes, capabilities, applications, and infrastructure components. Monitor Agent is an infrastructure component, which gets deployed in your Kubernetes cluster when you register a data plane. Monitor Agent uses the Kubernetes API to communicate with the Kubernetes API server in the cluster and sends the health status to TIBCO Control Plane.
For bare-metal data planes, TIBCO Control Plane monitors the connection status of Hawk domains and tunnel connectivity. TIBCO Control Plane also monitors the connection status of agents and the infrastructure components deployed after bare-metal data plane registration. TIBCO Control Plane uses agent and Hawk to monitor bare-metal TIBCO products.
Viewing Data Plane Status
The data planes Running card on the Home page provides the following information:
-
Number of data planes running successfully.
-
Number of data planes running with warnings.
-
Number of data planes reporting critical errors.
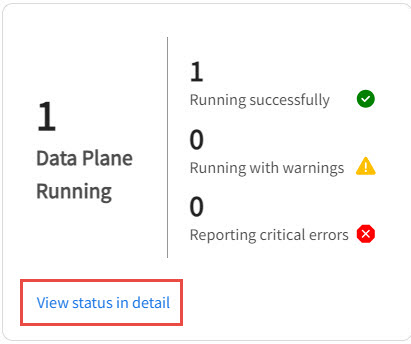
This includes both Kubernetes data planes and bare-metal data planes.
To view detailed status, click View status in detail.
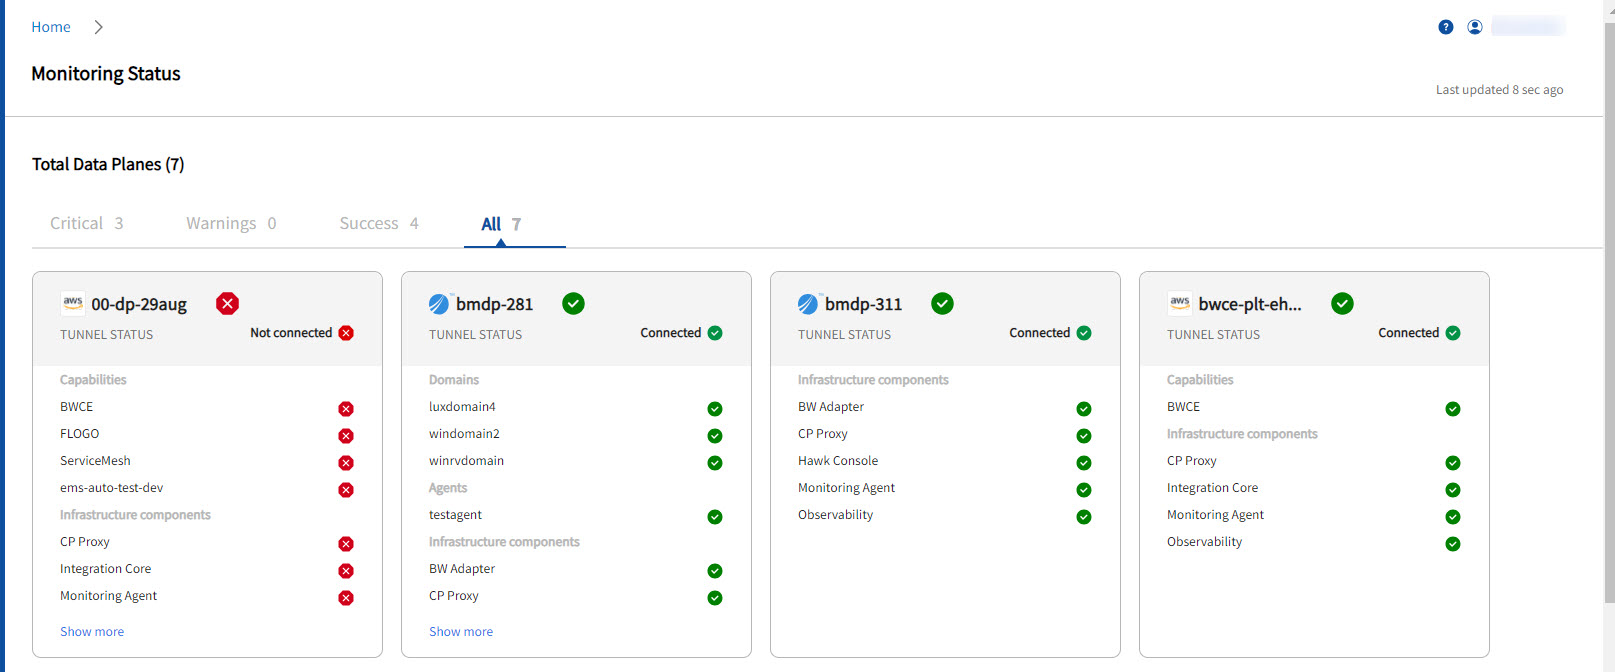
The Monitoring details page displays the runtime status of all the data planes and capabilities provisioned on the data plane. The data plane status is a rollup of health status of all the capabilities and infrastructure components deployed on the data plane. The Capability status is the rollup of health status of capability services.
For example, if the bwprovisioner service for the BWCE capability is in error state, the BWCE capability displays the error status and therefore the data plane displays the status as error. Health monitoring for capabilities only takes into account the mandatory components required for the capabilities to function successfully.
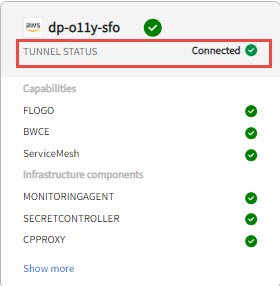
For bare-metal data plane, connectivity status of TIBCO Hawk domains, agents, tunnel connection status, and infrastructure component status are displayed.
The following table displays the possible health statuses for Kubernetes data planes:
| Status | Meaning |
|---|---|
Success  |
Data Plane status is success if all of its capabilities are in Success status, and all of its infrastructure components are in running state, and the tunnel for the data plane is in connected status. |
Warning  |
|
|
Error |
|

You can hover over data plane status to know more about the issue occurred.
Click the data plane card to view detailed status about capability or domain.
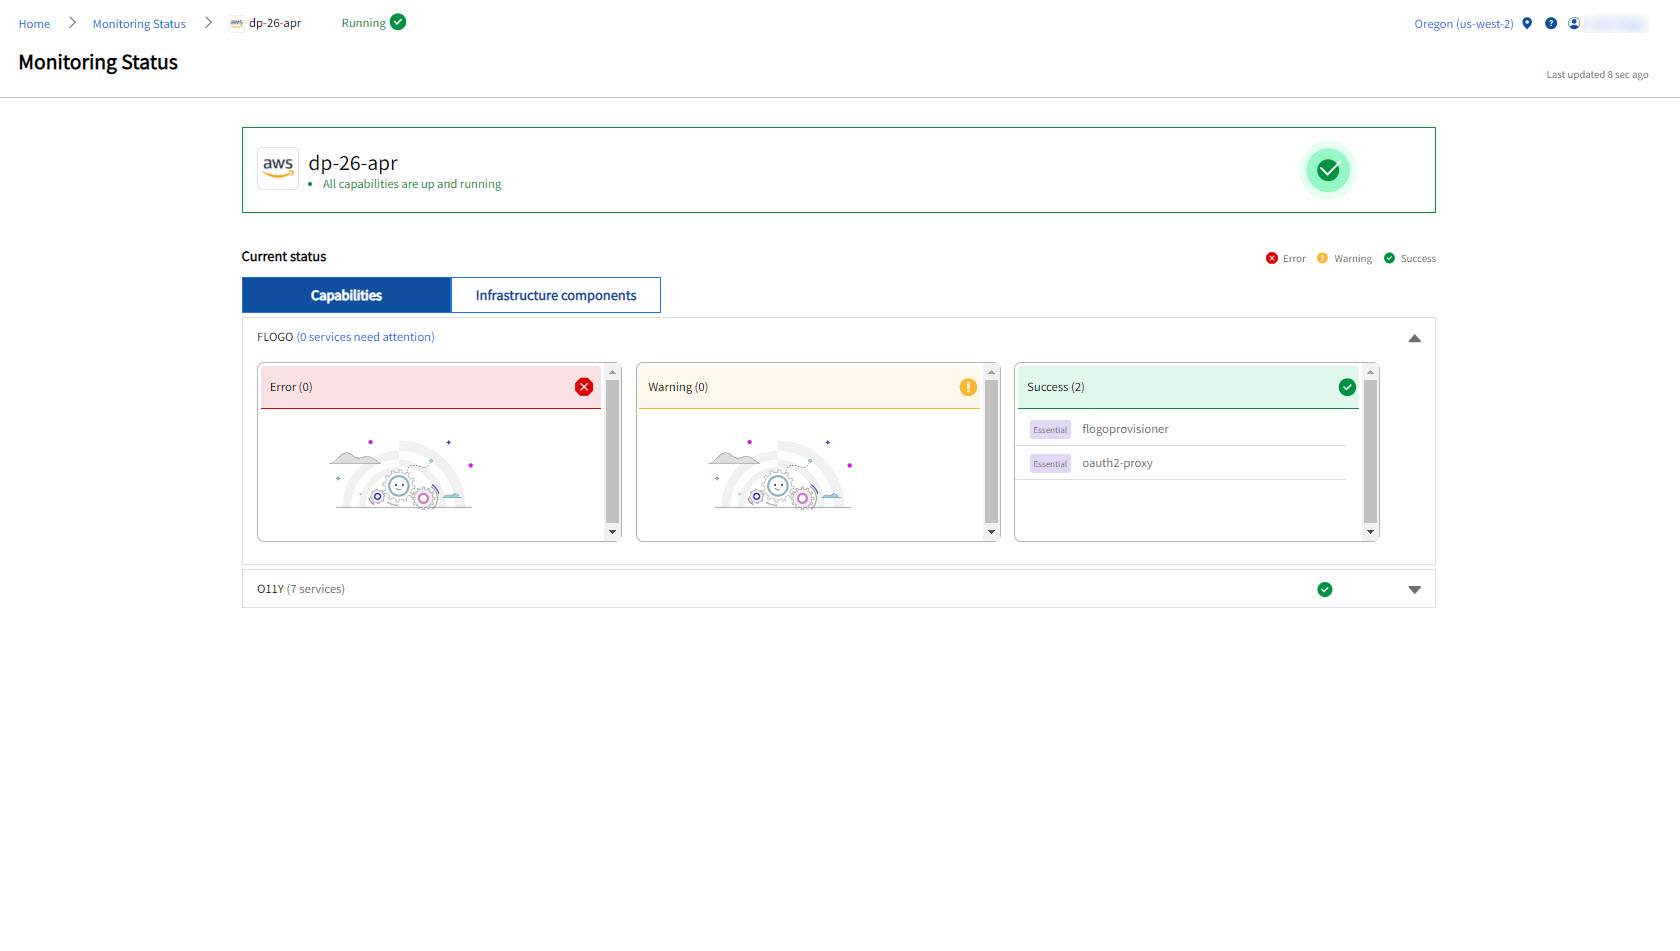
Capability Service Priority Labels
A label is displayed next to a capability service such as Essential, Helper, or Optional. This label displays priority of capability service in the monitoring status of capability and infrastructure component. Refer the following table for more information:
| Label | Description |
|---|---|
| Essential |
|
| Optional or Helper |
|
View Bare-Metal Data Plane Status
Monitoring Details page for bare-metal data plane.
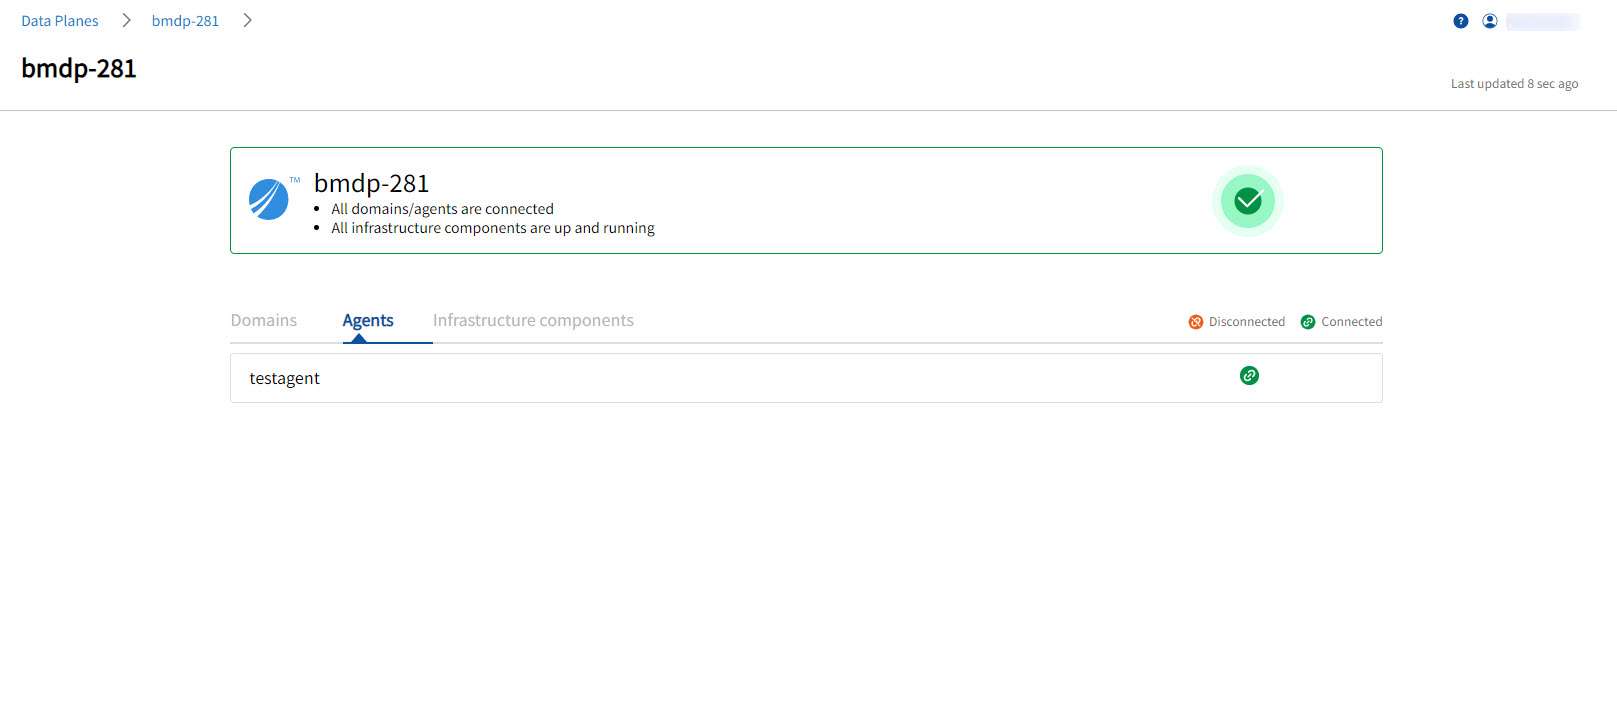
The following table displays the possible health statuses for bare-metal data planes:
| Status | Meaning |
|---|---|
| Success |
For bare-metal data plane, if all of the following are connected and running then data plane displays status as Success:
|
| Warning |
Bare-metal data plane indicates Warning status in the following scenarios:
|
|
Error |
|
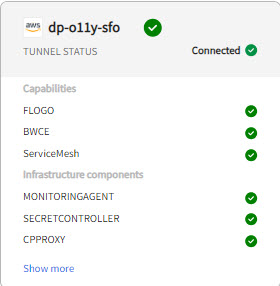
Viewing Tunnel Status
TIBCO Control Plane communicates to the data plane using tunnel. The tunnel is an infrastructure component, which gets deployed in your Kubernetes cluster. You can view the tunnel status on a data plane card on the Monitoring Status page. If the tunnel status is error, there might be an issue with connectivity between the data plane and TIBCO Control Plane.