Application CPU Utilization
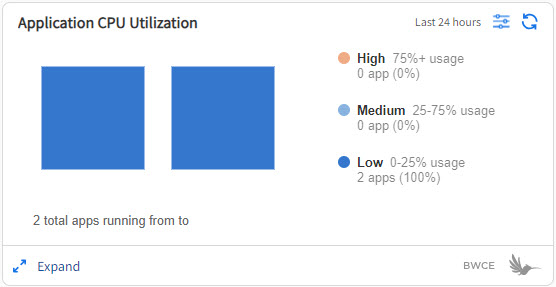
Application CPU utilization card displays the average percentage CPU usage distribution of the number of unique applications running over the selected time range. The percentage is the ratio of the amount of CPU utilization (in unit of core as 1 CPU) consumed by the main app container over the limit of CPU allocated for the container.
Application CPU utilization Details
The details page provides a graphical view to analyze average CPU utilization by an application over the time period. The time graph gives an observability of the number of apps that are under CPU load recorded in the target time window. By using the time range slider, you can narrow down to the exact participating apps in the bottom app list to do further analysis of the cause of the high CPU load.
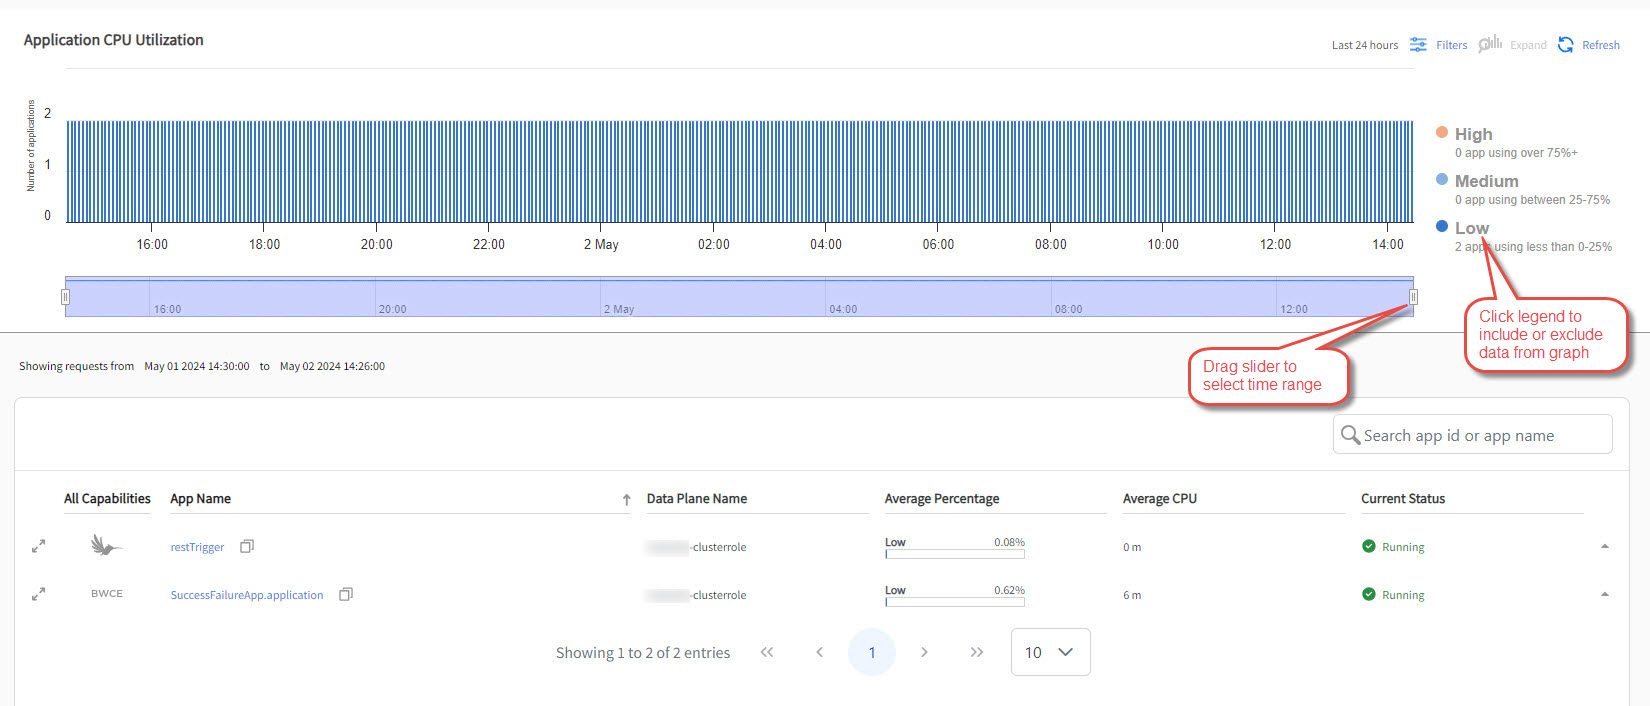
You can view the following information on the Application CPU utilization details page. The data displayed in the table is updated based on the time range that you select in the graph.
| Column | Description |
|---|---|
| All capabilities | Name of capability in which application is deployed |
| App name | Name of the application. Click the application name to view the app details page in a new window. If you click the dropdown arrow in the last column, you can view application instances names. |
| Data Plane name | Name of the data plane on which the application is deployed. |
| Average Percentage | The overall average ratio of CPU utilization over the allocated limit for the app container in the selected time range. |
| Average CPU | The overall average millicore utilized independent of the allocated limit. |
| Current Status | The status column displays the current runtime status of an application. The status is reported by the monitor agent. For more information about app status, see Viewing Application Status. |
To view logs and traces, click the Expand ![]() icon in the first column. For more information, see Analyzing Logs and Traces.
icon in the first column. For more information, see Analyzing Logs and Traces.