Quick Start
By using the quick start steps, you can deploy an existing TIBCO BusinessWorks™ Container Edition application in TIBCO Control Plane. Then you can monitor performance metrics, also analyze logs and traces.
The following is the workflow of deploying, managing, and monitoring your existing TIBCO BusinessWorks Container Edition application in TIBCO Control Plane.
- See System Requirements.
- If you have an existing Kubernetes cluster, see Preparing a Kubernetes Cluster for Data Plane Registration.
- Helm is installed and configured.
- You must have Data plane Manager, Capability Manager, and Application Manager permissions. For more information, refer Permissions.
Install TIBCO Control Plane
If you want to use self-hosted version of TIBCO Control Plane, you must first install TIBCO Control Plane. To deploy TIBCO Control Plane in your Kubernetes cluster, see Deploying TIBCO Control Plane in a Kubernetes Cluster.
Alternatively, if you want to use TIBCO Operated Control Plane, you can skip this step.
Signing in to TIBCO Control Plane
TIBCO Operated Control Plane
You can sign in to TIBCO Control Plane by using your corporate account or with a TIBCO account. Newly added users receive an email to sign in to TIBCO Control Plane. Invited users need to click the link in the email to accept the invite and sign in.
You can see two options to sign in:
-
To sign in using your corporate account, click Your corporate account. You are redirected to the configured IdP sign-in page.
-
To sign in using a TIBCO account, click Sign in with TIBCO Account. User can sign in with a TIBCO account if the TIBCO Account Sign in checkbox is selected when adding a user.

Self-Hosted TIBCO Control Plane
You can sign in to self-hosted TIBCO Control Plane by using default IdP or with your corporate account. For more information about Single Sign-On using corporate account, see Configure IdP.
You can see two options to sign in:
-
To sign in using default IdP, click Sign in with Default IdP.
-
To sign in using your corporate account, click Your corporate account. You will be redirected to the configured IdP sign in page.
Registering a Data Plane
You have to register your existing Kubernetes cluster as a data plane before you start using the different capabilities provided by TIBCO Control Plane. When you register a Kubernetes cluster as a data plane, TIBCO Control Plane infrastructure components get deployed in your Kubernetes cluster. These infrastructure components are required to create the connection between data plane and TIBCO Control Plane.
- Procedure
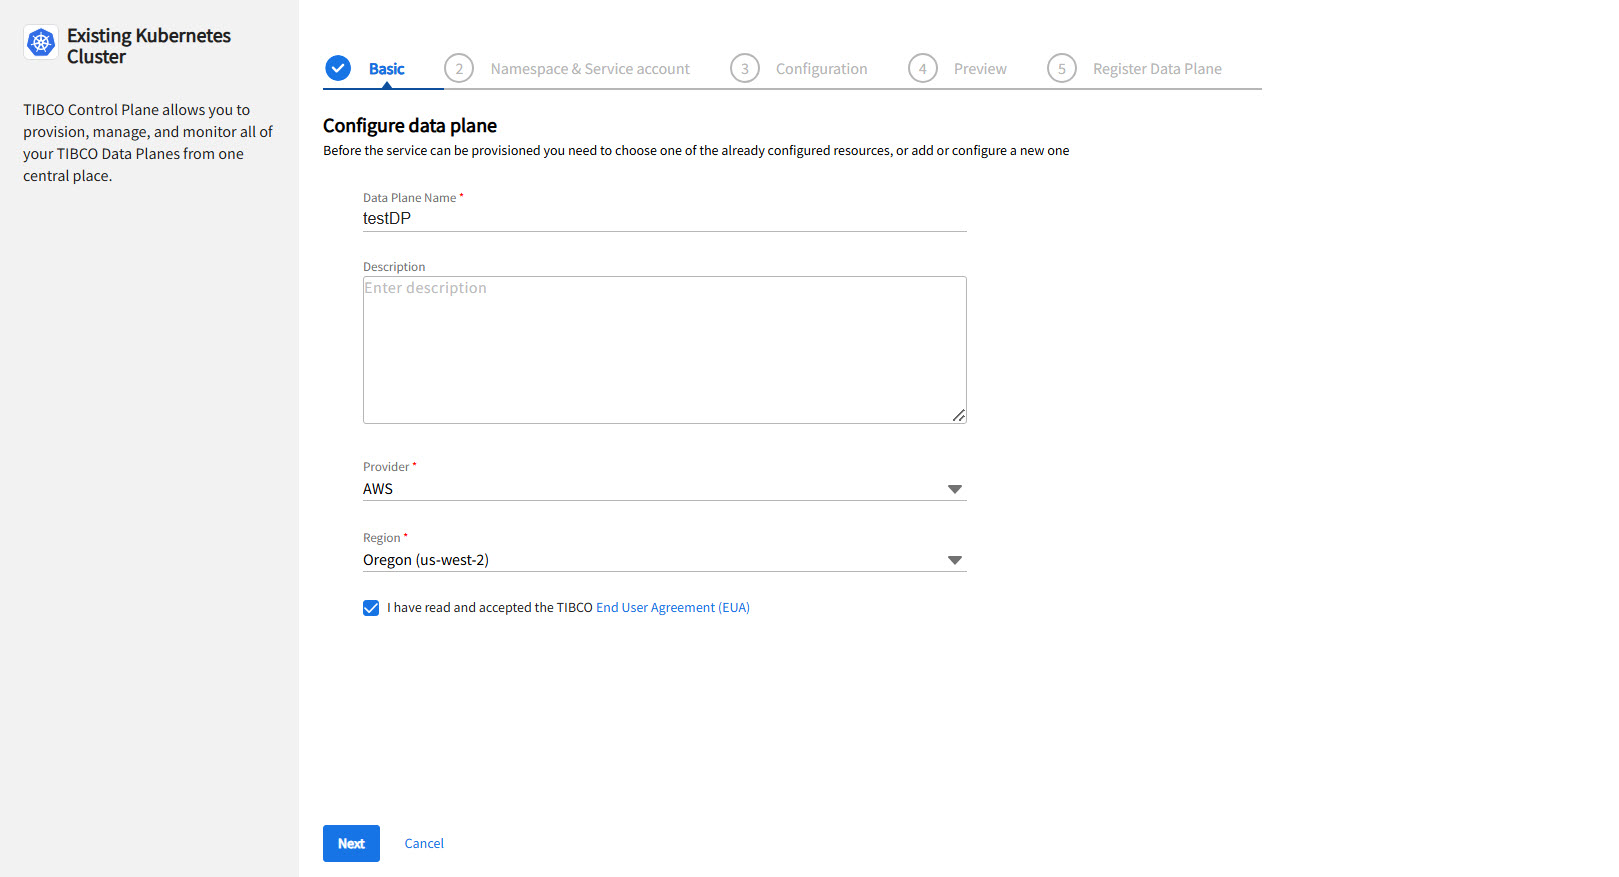
- On TIBCO Control Plane home page, click Register a Data Plane.
- On the Existing Kubernetes Cluster card, click Start.
-
Complete all the steps of the Register Data plane wizard.
- On the Register a Data Plane page, the helm commands for namespace creation, service account creation, and cluster registration are provided. Download and Run the helm commands in your Kubernetes cluster in the sequence specified on the screen. It is mandatory to run all three commands whether you have an existing namespace and service account or you want to create a new one.
After registering the data plane, the status on the data plane card is red for few minutes and then the data plane status changes from red to green. The monitor agent gets the status information for all infrastructure components. For more information about data plane and infrastructure component statuses, see Monitoring. As a next step, provision a capability on the data plane.
Provisioning a Capability
Before you start using the capability and applications of capability, you need to first provision a capability. When you provision a capability, infrastructure components specific to the capability get deployed in your Kubernetes cluster.
- Procedure
-
In TIBCO Control Plane, click Data Planes from the left navigation.
-
On the Data Plane card, click Go to Data Plane.
-
Then click Provision a Capability.
-
On the Provision TIBCO BusinessWorks™ Container Edition card, click Start.
-
Select the storage required and ingress controller resource to provision capability. If there is no existing resource, you can add a resource. For more information about resources, see Managing Resources.
-
Click Next.
-
Add the path prefix in the Path Prefix textbox for the ingress resource that is used for provisioning public APIs. Select the EULA checkbox to accept the End-User License Agreement.
-
Click Provision BWCE Capability. It takes some time to provision the capability.
After you have provisioned a capability, you see that a capability card gets added on the data plane details page. In the next step, you have to deploy a BWCE app on the data plane.
Deploying an App
In this step, you upload an existing EAR file in TIBCO Control Plane and deploy the application in your Kubernetes cluster.
- Procedure
-
Go to the data plane details page and click Deploy App.
-
On the Deploy BusinessWorks card, click Start and complete all the steps of app deploy wizard.
After deploying the app successfully, the app is listed in the applications list on the data plane details page. Click the app to go to the app details page.
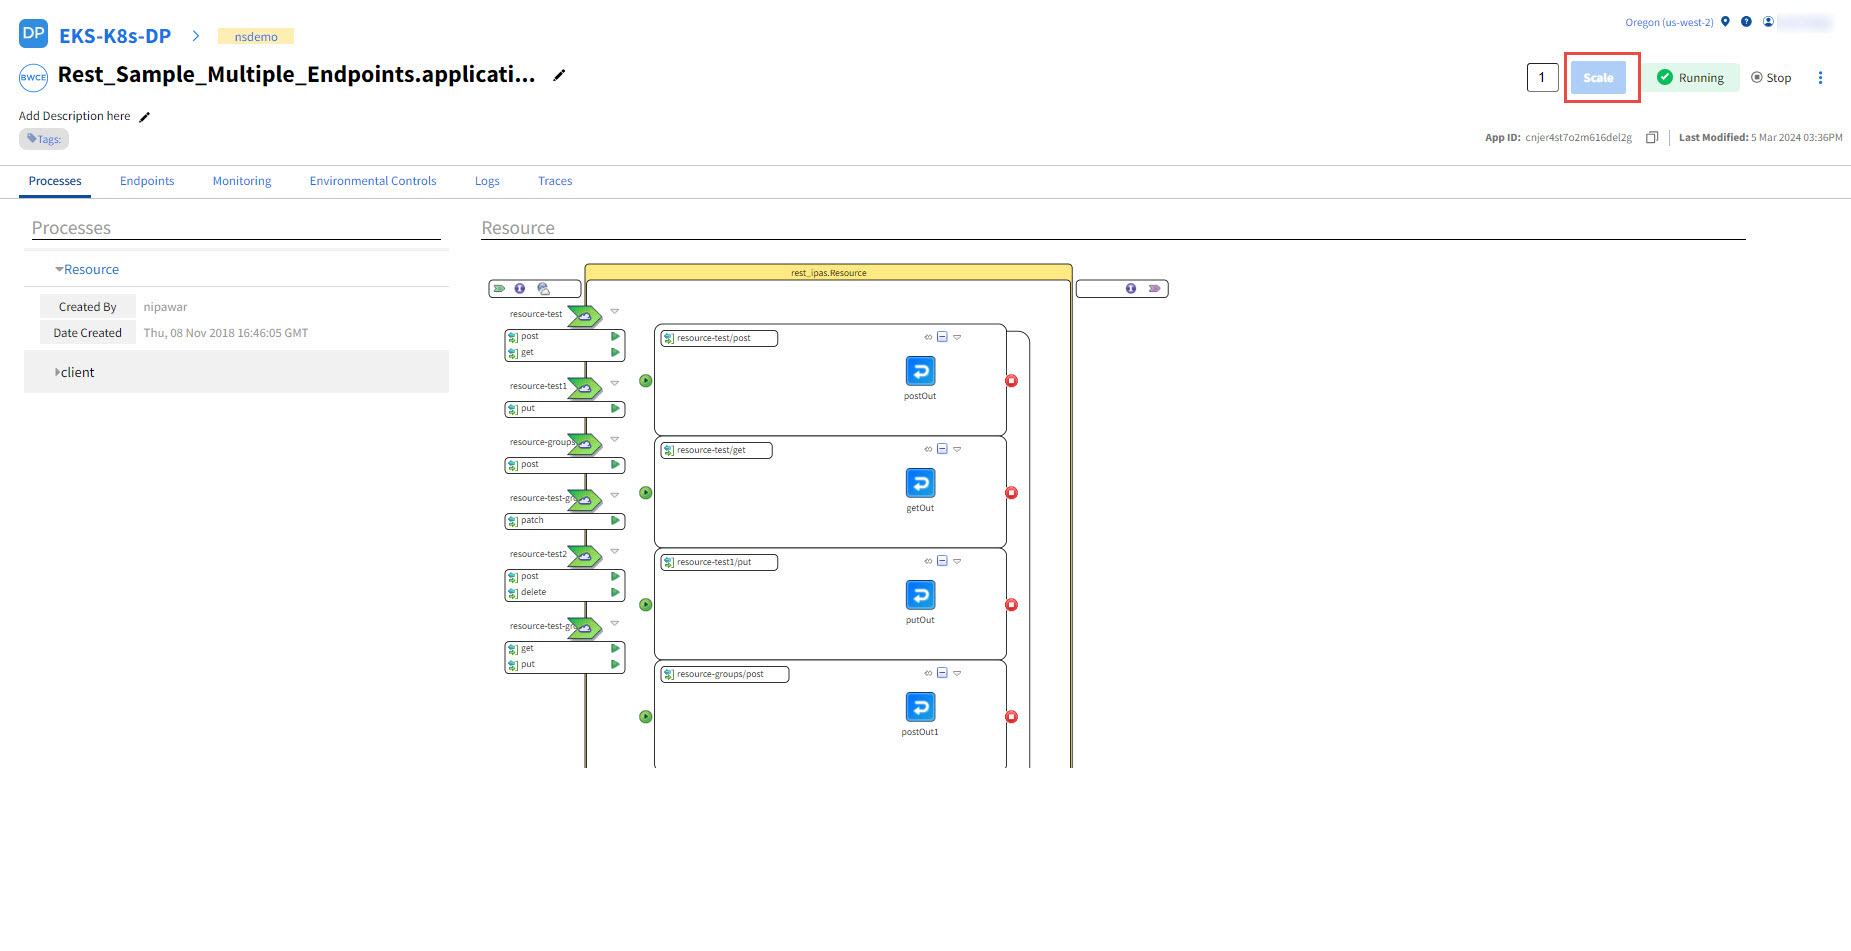
Scaling the App
- Procedure
-
In TIBCO Control Plane, go to the app details page.
-
In the top-right corner, specify number of instances to scale.
-
Click Scale.
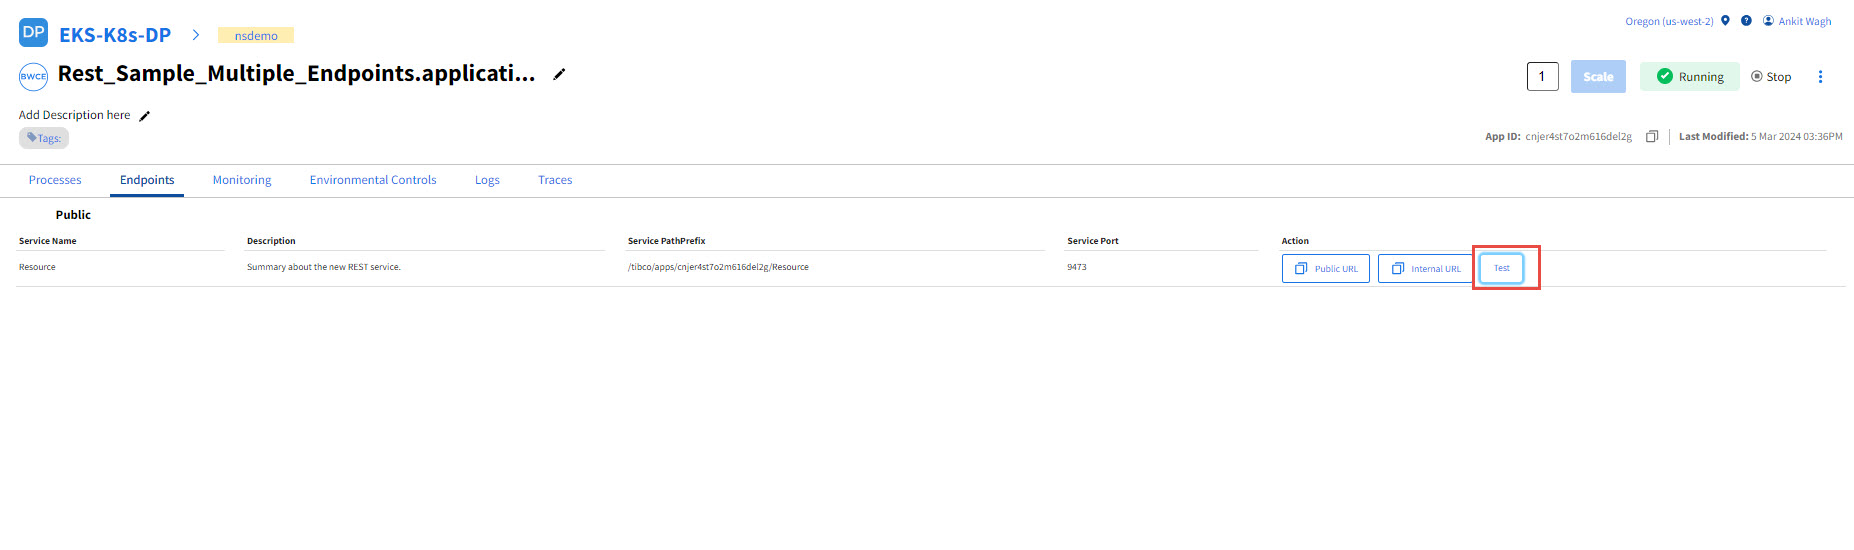
Viewing Endpoints
- Procedure
-
Sign in to TIBCO Control Plane and go to the data plane details page.
-
From the list of applications, click a running TIBCO BusinessWorks Container Edition application.
-
Click the Endpoints tab. All the endpoints are shown.
-
Click Test to display the contents of the URL in Swagger.
Viewing Performance Monitoring Statistics
You can monitor app performance metrics such as Memory and CPU usage by performing the following steps:
- Procedure
-
Sign in to TIBCO Control Plane and go to the data plane details page.
-
From the list of applications, click a running TIBCO BusinessWorks Container Edition application.
-
Click the Monitoring tab.
Viewing Logs and Traces
To troubleshoot issues with an application, you can analyze logs and traces for an application.
- Procedure
-
Sign in to TIBCO Control Plane and navigate to the Data Plane details page.
-
From the list of applications, click a running TIBCO BusinessWorks Container Edition application.
-
Click the Logs tab.
-
Click Filters to filter by using a custom time range.
-
To view traces, on the app details page, click the Traces tab. You must have configured the Observability resource to view traces.
You have now deployed your first app in TIBCO Control Plane. This section describes just one way to get started with TIBCO Control Plane. See the following topics for the complete documentation about this workflow.