Analyzing Logs and Traces
You can use TIBCO Control Plane to debug issues with applications by analyzing logs and traces. TIBCO Control Plane provides single interface to view logs and traces for applications deployed on data planes.
Viewing Logs and Traces
You can view Logs and Traces by using one of the following ways:
From the Observability page
-
On the Observability page, click Expand on a card.
-
You can view logs and traces for an application in one of the following ways:
-
In the list of applications, click the Expand
 icon. The Logs and traces window is opened. You can keep this window open and view logs and traces as you click on other application names in the list.
 -
Click an application name to open application details page in a new tab.
-
From the Application Details page
On the application details page, click Logs and Traces tabs to view the Logs and Traces data for an application.
Logs
The Logs tab displays both Real-time logs and historical logs. Real-time logs are refreshed every 10 seconds. In historical logs, logs for last 5 minutes are displayed. Log level (Info, Debug, Warning, Error) is displayed in the first column. You can switch between Table view and Raw view. You can search through log entries using the search box.
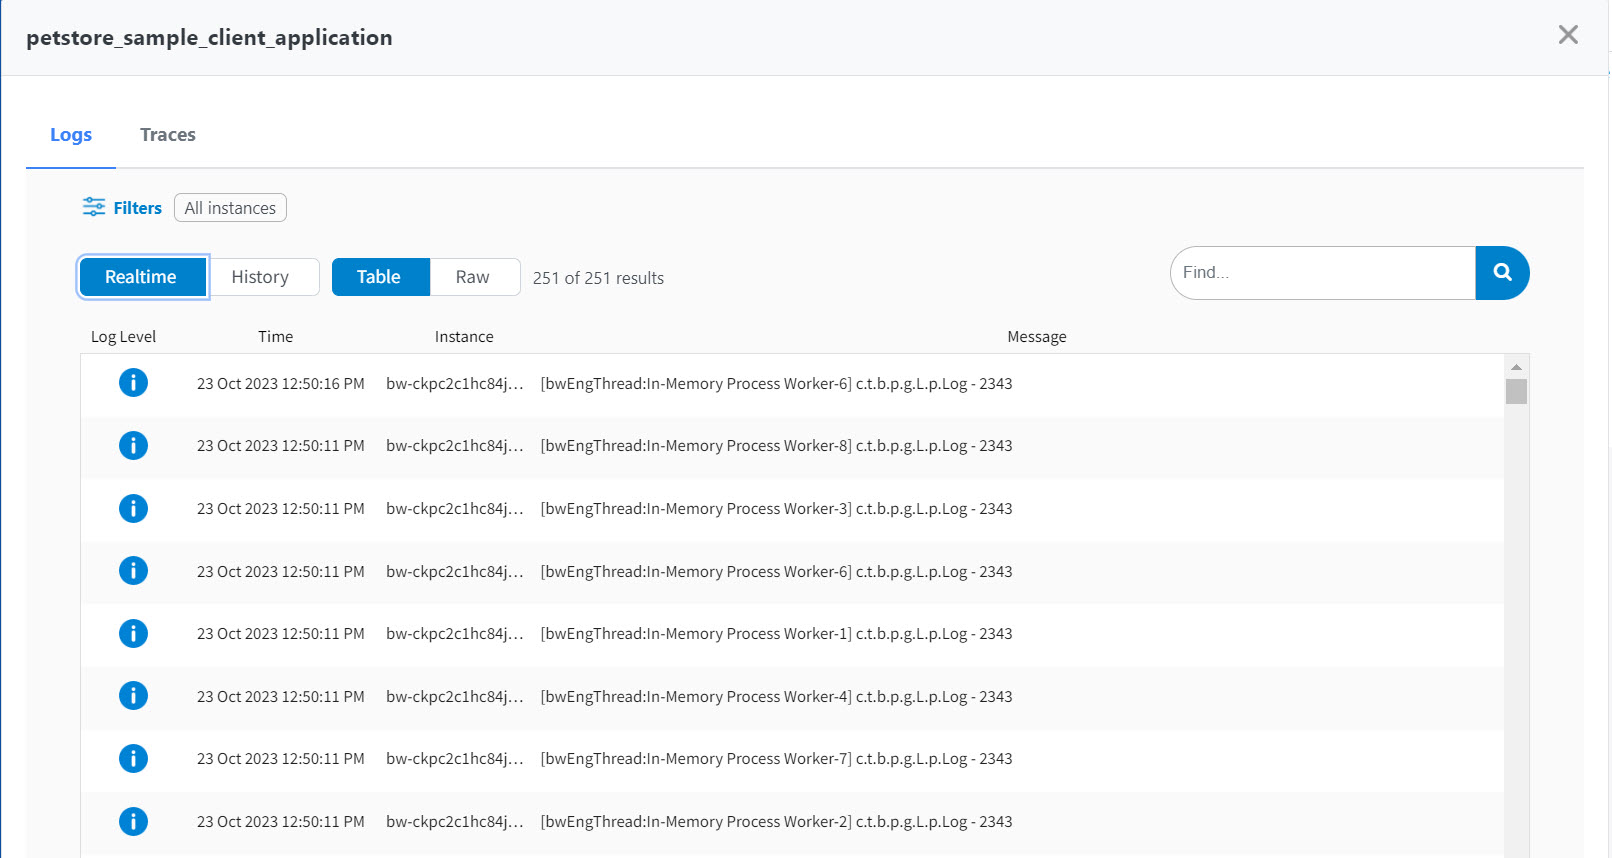
To filter the log data, click Filters. You can filter the data by using time range, custom date and time range, Log level, and application instances.

Traces
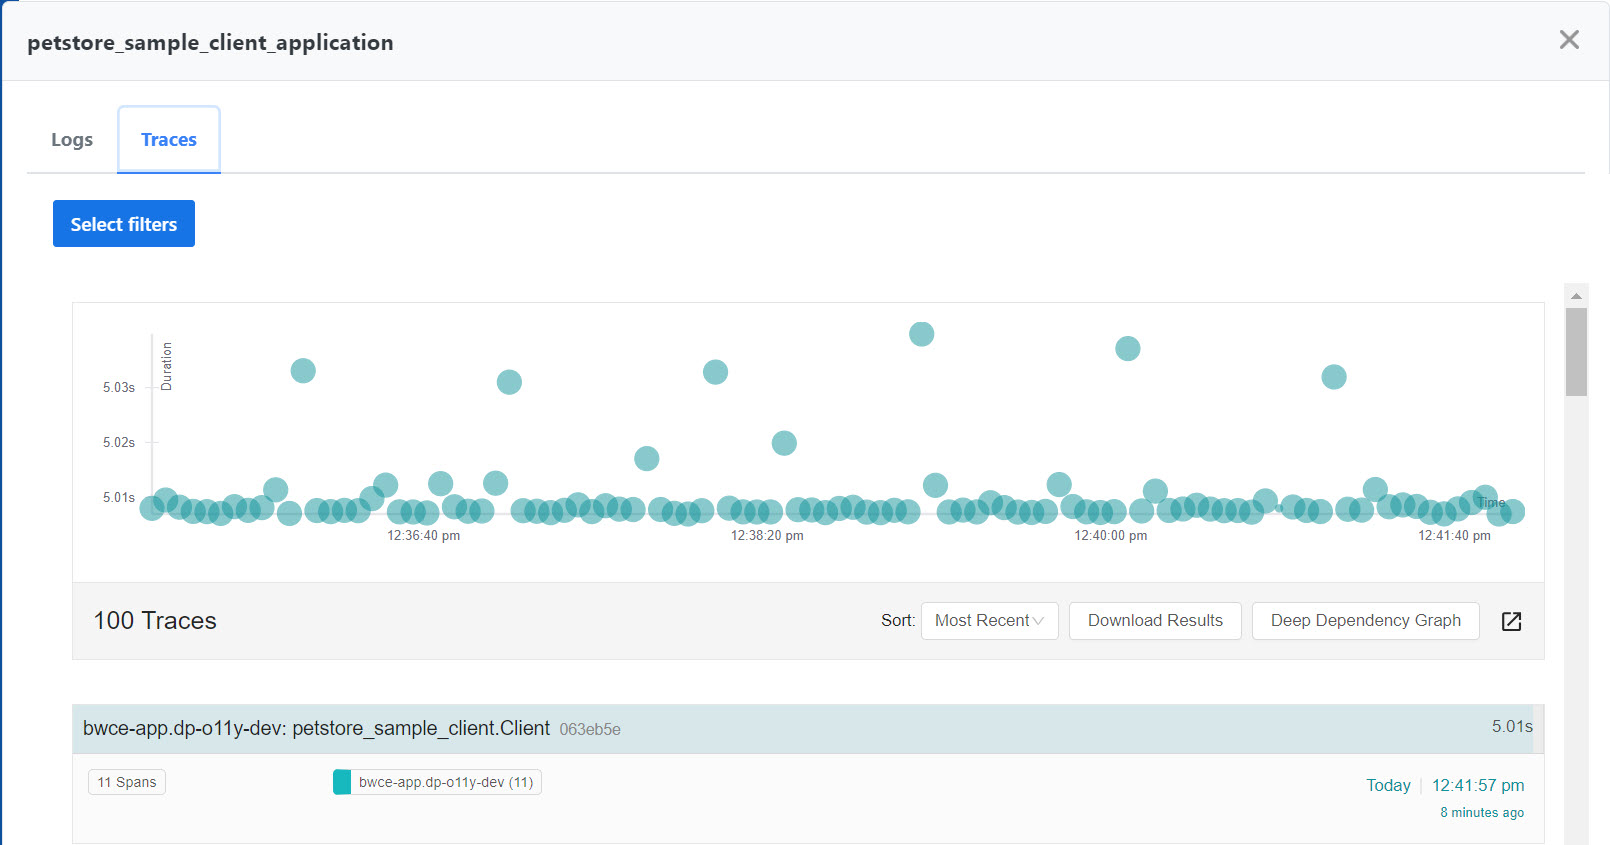
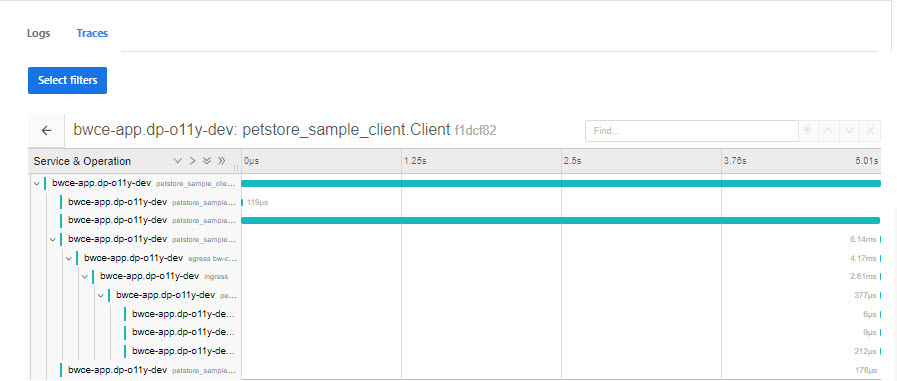
The Traces tab displays the traces for an application. A trace represents a complete execution made up of single or multiple spans. By default the graph displays 100 traces and traces data for the last hour. Click a trace on the graph to view trace details.
Trace Details View
On the Traces tab, you can perform the following tasks:
-
To filter data, click Select filters. You can filter by using time range and number of traces.
-
To download the traces, click Download Results.
-
Sort the data based on predefined options from the Sort dropdown.
-
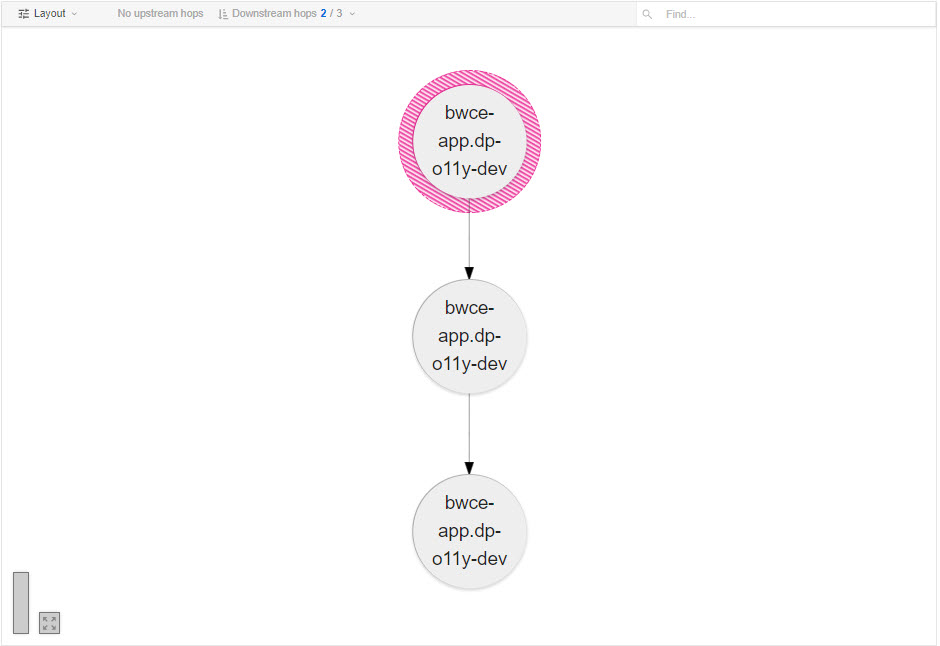
To view dependency between services, click Deep Dependency Graph.
The Deep Dependency Graph displays transitive dependency between services. The deep dependency graph describes how the services in traces are connected.