Viewing Traces for Control Tower Applications
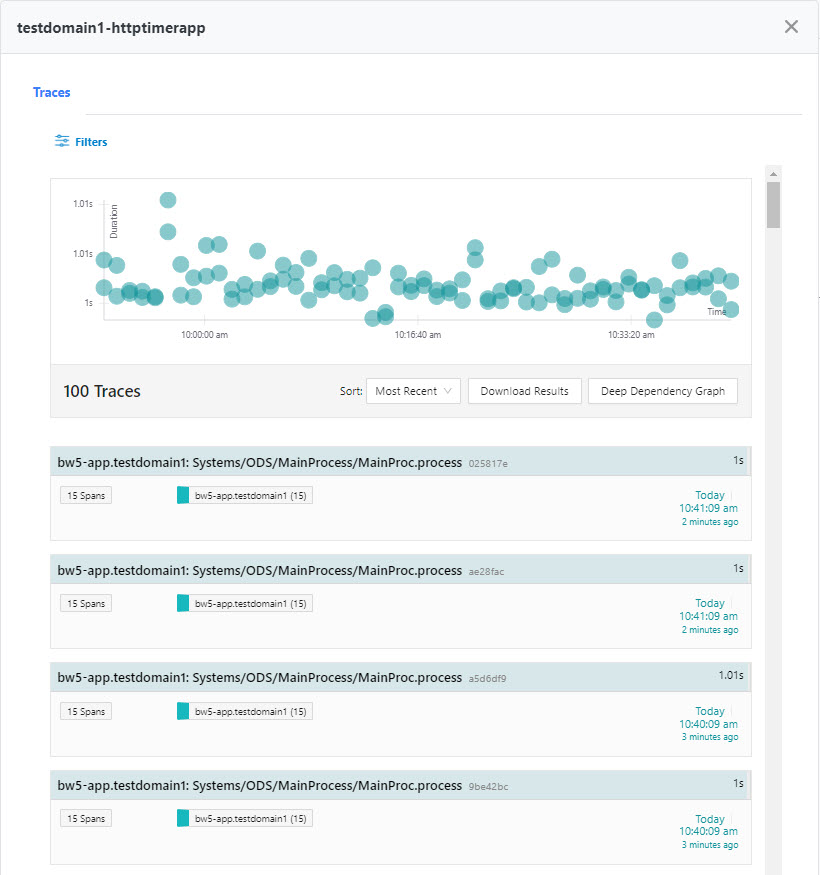
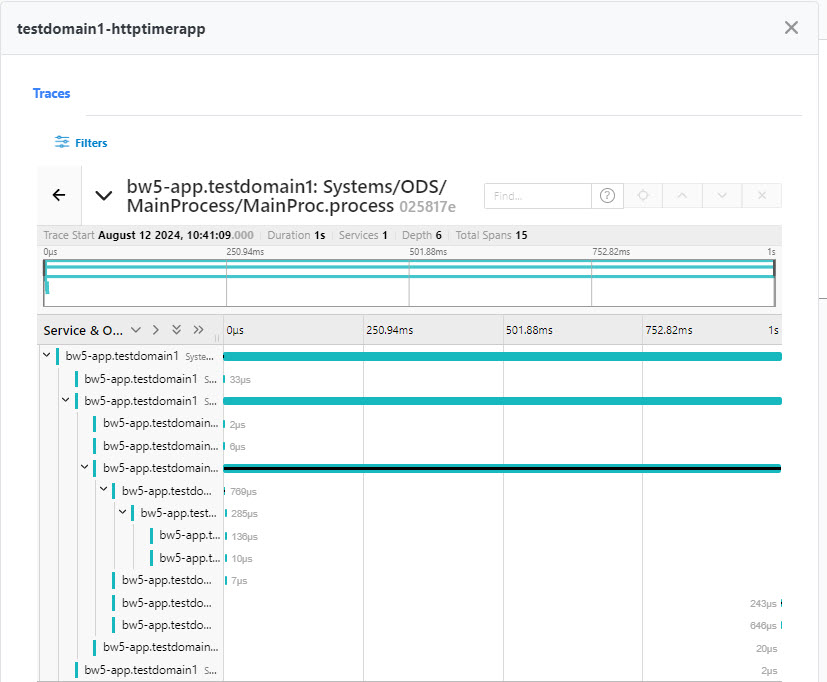
The Traces tab displays the traces for an application. A trace represents a complete execution made up of single or multiple spans. By default the graph displays 100 traces and traces data for the last hour. Click a trace on the graph to view trace details.
Trace Details View
On the Traces tab, you can perform the following tasks:
-
To filter data, click Select filters. You can filter by using time range and number of traces.
-
To download the traces, click Download Results.
-
Sort the data based on predefined options from the Sort dropdown.
-
To view dependency between services, click Deep Dependency Graph.