Configuring Observability Resource
You can configure the observability resource at the global level or at the data plane level. Observability resource configured at a global level can be applied to all data planes. It is not applied by default. You must link the data planes to the global resource. Observability resource at the data plane level applies specifically to the chosen data plane.
You can use either the global scope resource or the data plane scope resource for a data plane at any given time. Global scope allows multiple data planes to be linked to the same set of observability stack for collecting the telemetry data. This allows observability and monitoring of telemetry data across data planes in a single view.
The following are some of the scenarios for using global scope observability resource:
-
Traces that span across data plane when an app in data plane A is invoking an app in data plane B.
-
Metrics that monitor the high CPU or memory usage of apps in all data planes.
-
Logs from multiple app instances in multiple data planes to be collated in a single view sorted by time.
- You must have configured the Logs server, Traces server, and Metrics server in your Kubernetes cluster. See System Requirements for supported tools.
- To configure the Logs server, Traces server, and Metrics server in your Kubernetes cluster to collect data from data planes, see the following topics:
-
You must have installed Kubernetes Metrics Server. For more information, see Kubernetes Metrics Server on GitHub.
- You must have following permissions:
- To configure the Observability resource at the global level, you must have Owner or Team Admin permission.
- To configure the Observability resource at the data plane level, you must have Data plane Manager permission. For more information, refer Permissions.
Configuring Observability Resource at the Global level
- Procedure
- In the TIBCO Control Plane UI, click Data Planes.
-
Click Global configuration in the upper-right corner.
-
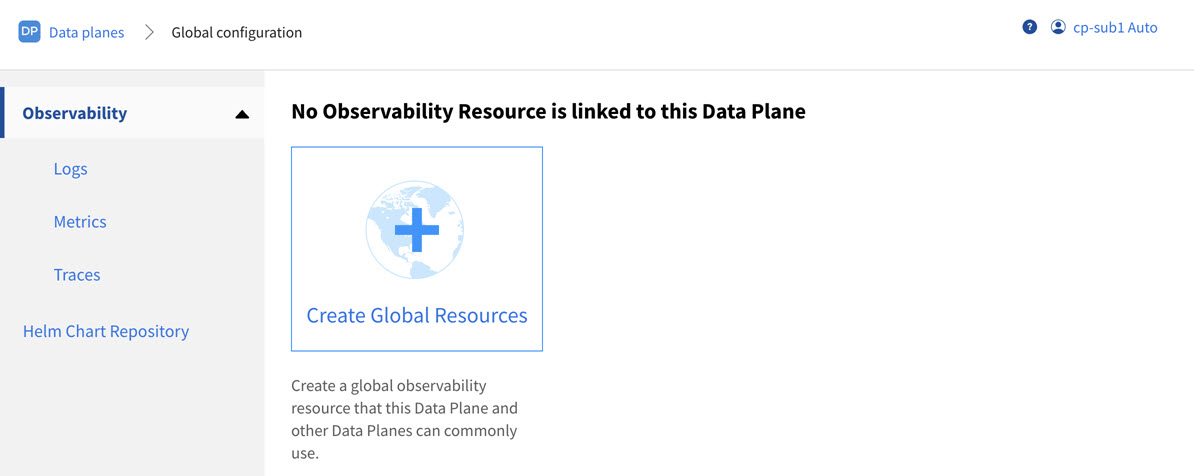
On the Observability page, click Create Global Resources.
-
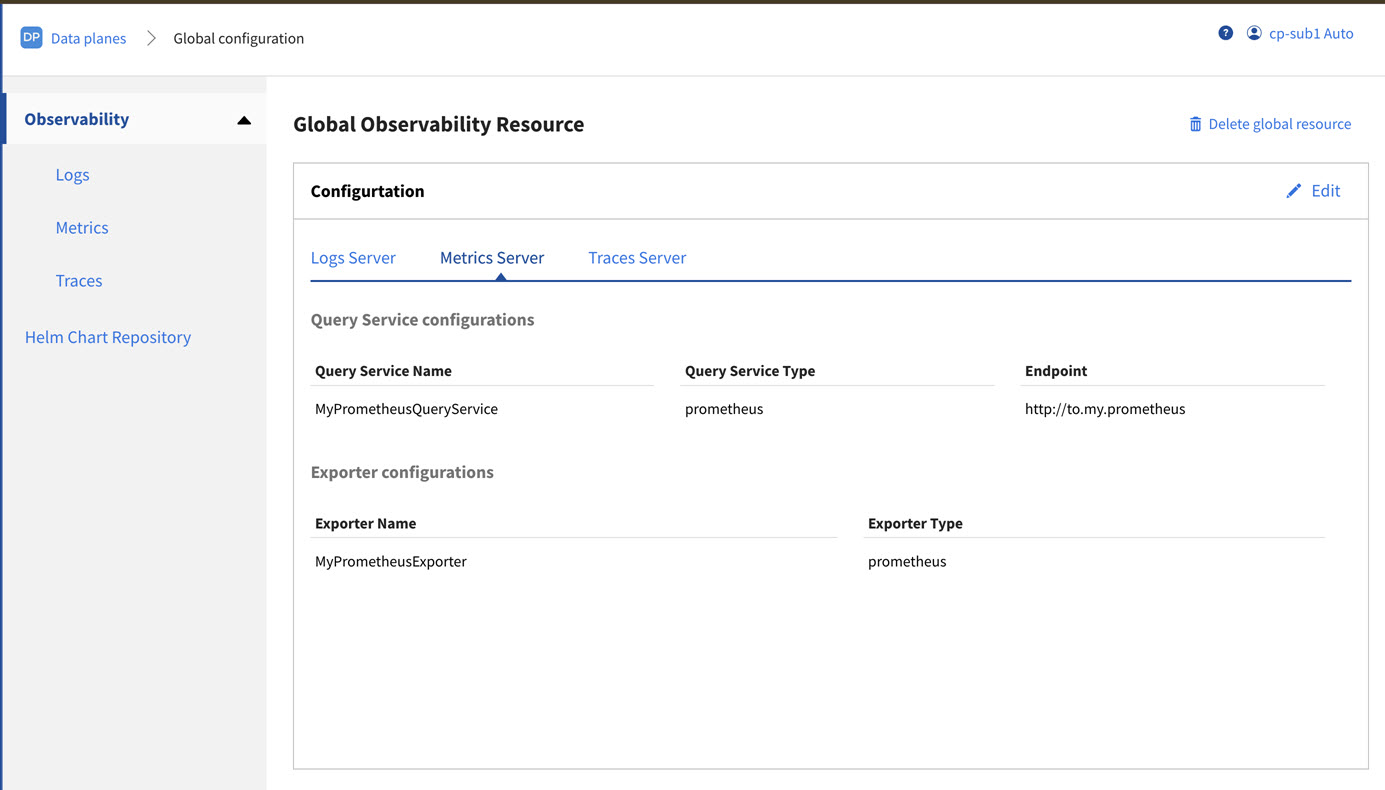
Specify the configuration for Logs Server, Traces Server, and Metrics Server. For more information about the configuration fields, refer Observability Resource.
You can create multiple Query Services and Exporters for each of the Logs Server, Metrics Server, and Traces Server and select one of each to associate with the Observability resource of Global and Data Plane level scopes.
- Click Save.
To access the list of Query Services and Exporters of each of Logs, Metrics and Traces at the global level scope, navigate to the sub tabs of under Observability menu.
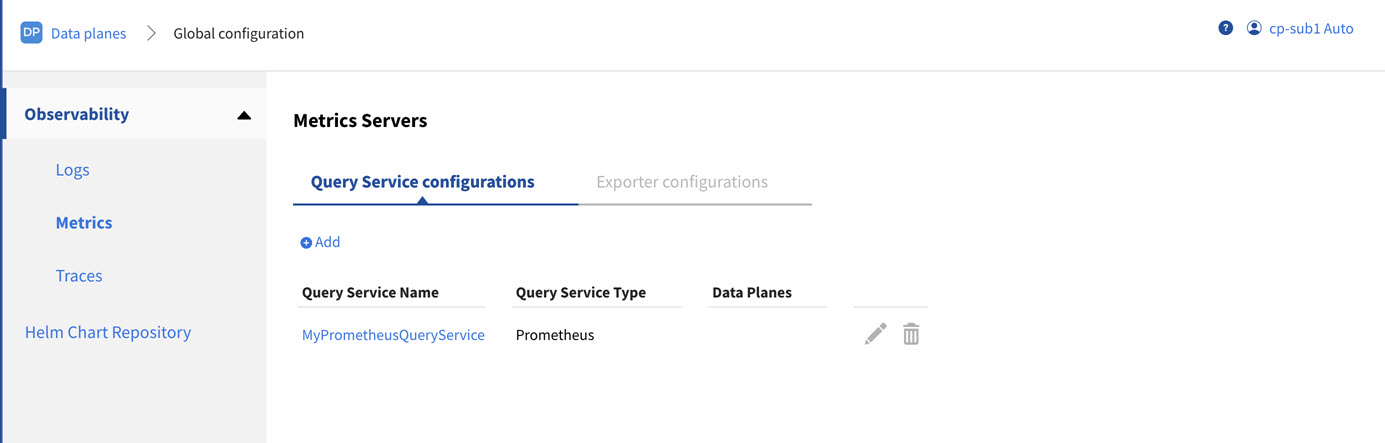
At the Global level, the Data Planes column indicates the list of associated data planes (if any) that are currently in use.
Configuring Observability Resource at the Data Plane level
You can configure Observability Resource Configuration at individual data plane so it is not shared across multiple data planes like the Global Observability resource.
- Procedure
- In TIBCO Control Plane UI, click Data Planes.
- Click the data plane card for which you want to configure the Observability resource.
-
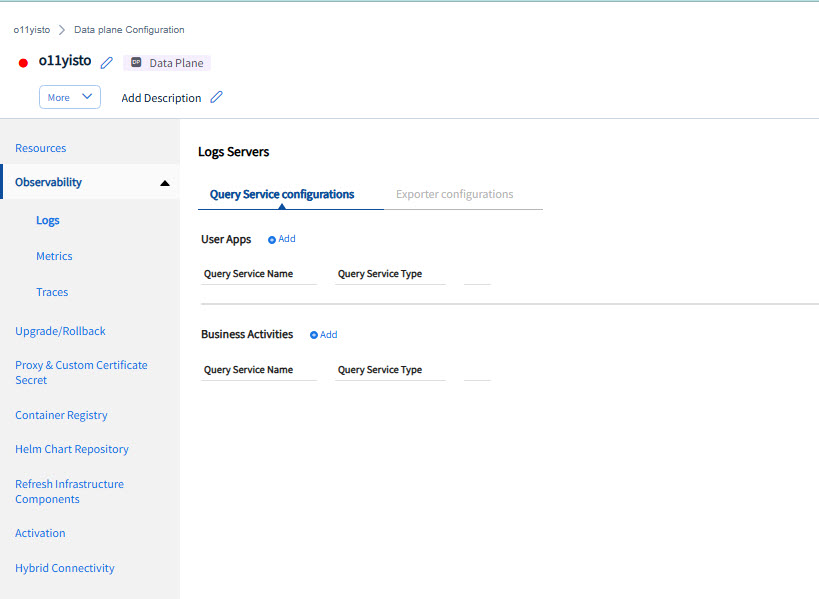
Click Data Plane Configuration and then navigate to the Observability page.
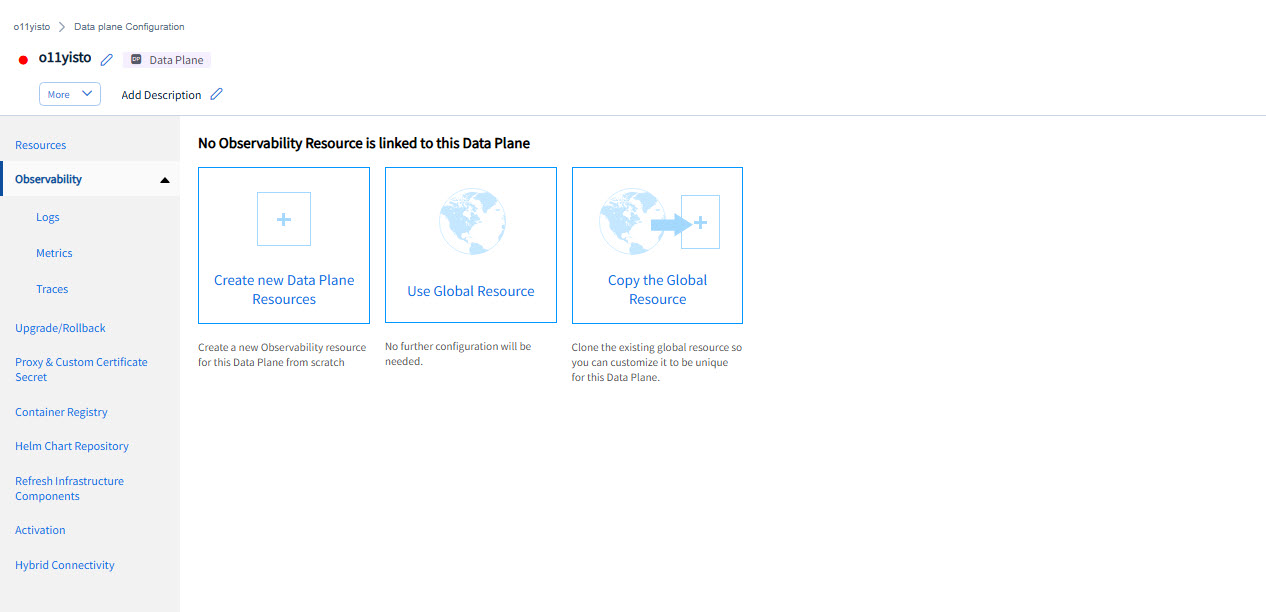
- Perform one of the following tasks:
- To use the global resource for the data plane, click Use Global resource.
- To create a separate observability resource at the data plane level with the same global resource configuration, click Copy the Global Resource.
- To create a new observability resource at the data plane level, click Create new Data Plane Resources.
- Specify the configuration for Logs Server, Traces Server, and Metrics Server. For more information about the configuration fields, refer Observability Resource. You can select Query Service and Exporter for Logs, Metrics and Traces that are created at both the Global Observability resource and Data Plane level resource. When creating data plane level configuration, Query service or Exporter from global configuration is visible to use.
- Click Save.
To access the list of Query Services and Exporters of each of Logs, Metrics and Traces at the data plane level scope, navigate to the sub tabs of under Observability menu.
The listings of the Query Services and Exporters under the sub tabs of Logs, Metrics and Traces servers display only those that are created for this data plane. You cannot view the Query Services and Exporters that are created in the Global Observability resource configuration.
The Observability resource is added successfully.
You can switch between Global resource and data plane level resource by clicking the Switch to Global resource button. When you switch from data plane level resource to global level resource, data plane level resources are unlinked and deleted in the Control Plane and updated with global level resources.
After the Observability resource is added, click the Observability menu. The Observability page displays dashboards such as application instances, requests count, CPU utilization, and memory usage.