Customizing Observability Dashboard
You can customize the layout and filters of the Observability dashboard. User-specific profiles are saved automatically and can be restored later. You can also create snapshots of their profiles and reset to a default profile.
Customization Options
Users can customize the dashboard as follows:
-
Adding metrics cards: Select cards from Platform Capabilities, including BW6 (Containers), Flogo, and EMS on Kubernetes Data Plane, and BW5 on Control Tower.
-
Reordering cards: Choose the order in which cards appear on the dashboard.
-
Adding multiple cards of the same type with different filter criteria.
User Profile
Autosave Profile
Changes in the custom observability dashboard layout and filters are saved automatically as profile unique to the user. This allows the same user to log in on any browser and the saved custom layout and corresponding filters are automatically restored from the autosaved profile.
Snapshot Profile
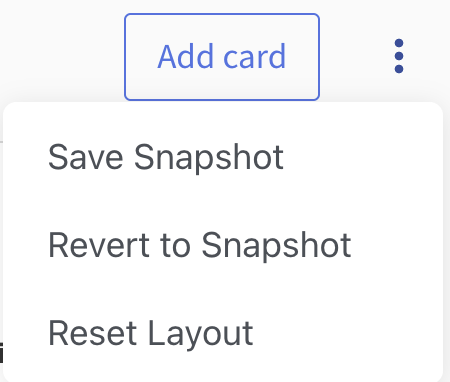
Users can save a snapshot of the current profile as a checkpoint that can be restored later. Click the Ellipsis icon next to the Add card button. Select Save Snapshot to save a snapshot of the current profile.
Default Profile
On the first-time login to TIBCO Control Plane, a default profile is loaded with the following set of cards. You must have respective capabilities provisioned to view the default cards.
Your profile is autosaved if you do any customization in the dashboard. The dashboard data is based on the context of the Data Plane or Global observability resource configuration selected in the main dropdown menu. When you reset your profile back to default, all your previously saved custom layout and filters are removed and will no longer be available.
Default Cards
- Integration Summary
- BW6 (Containers) and Flogo Capabilities on Kubernetes Data Planes
- Application Request Counts
- Application CPU Utilization
- Application Memory Utilization
- EMS Capability for Kubernetes Data Planes
- EMS Server Messages
- EMS Server CPU Utilization
- EMS Server Memory Usage
- BW5 Capability on Control Tower
- Application Request Counts
- Application CPU Utilization
- Application Memory Usage
Adding a Card to the Dashboard
To customize Observability dashboard, add metrics cards from the available metrics.
- Procedure
- In the TIBCO Control Plane UI, click Observability menu from the left navigation.
-
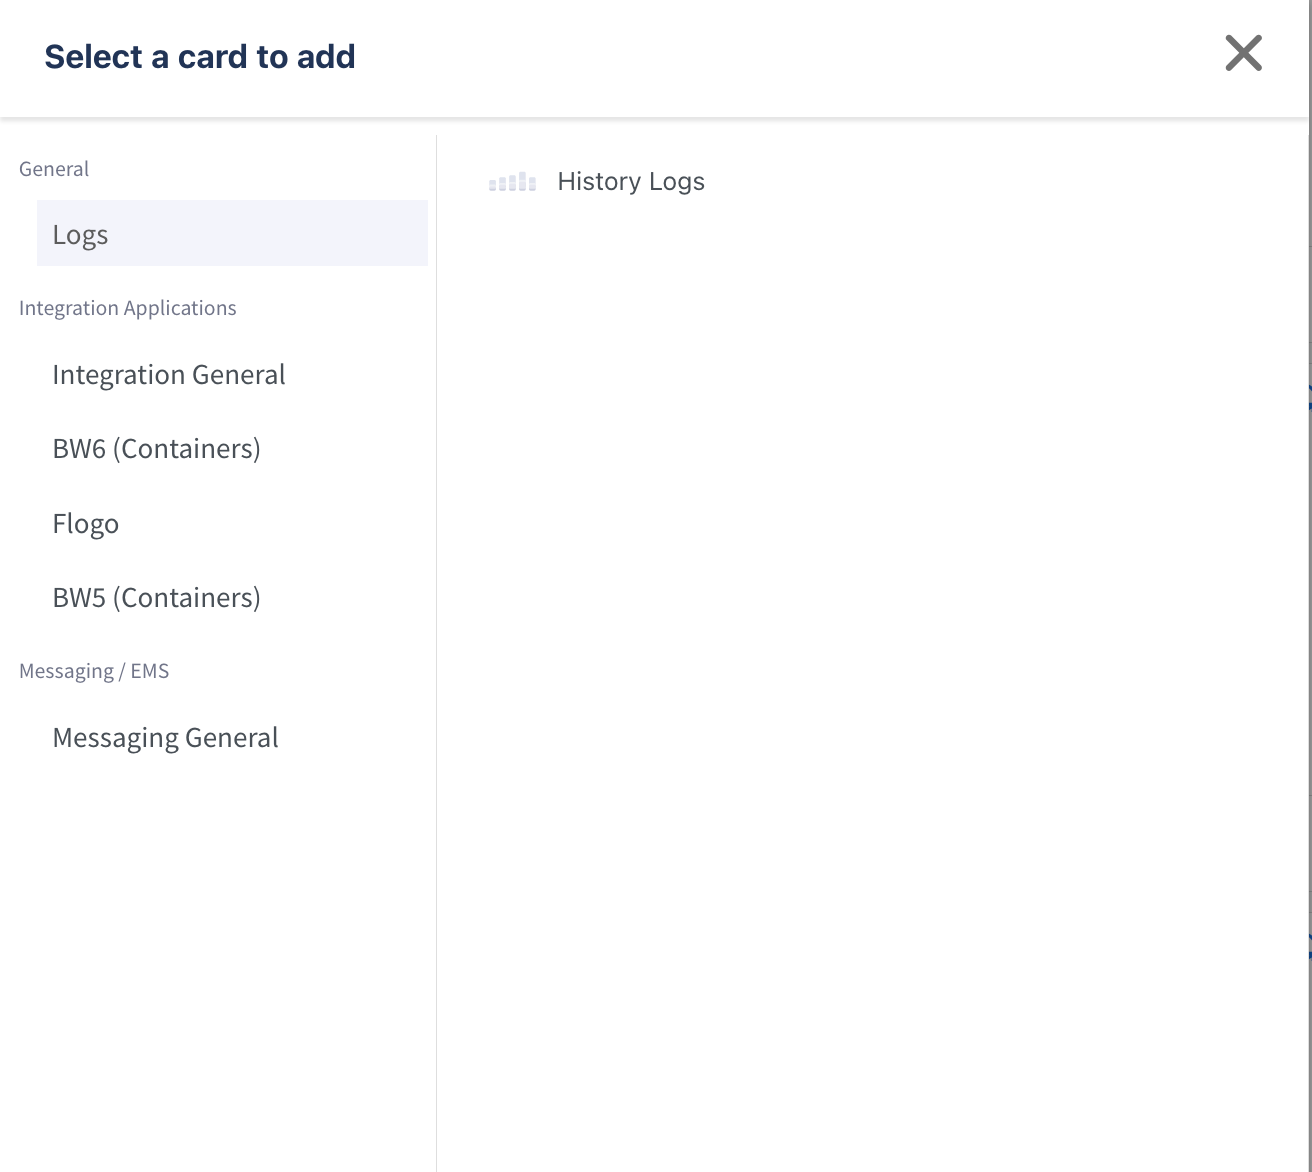
Click Add Card in the upper-right corner.
-
Select metrics to add.
-
Click Add to dashboard.
The selected metrics card gets added to the dashboard.