Annotations are text boxes that can be added on top of a visualization. You can use them for various presentation purposes like explaining what is displayed in the visualization or informing of interesting findings. They can also be used for adding instructions or asking questions.
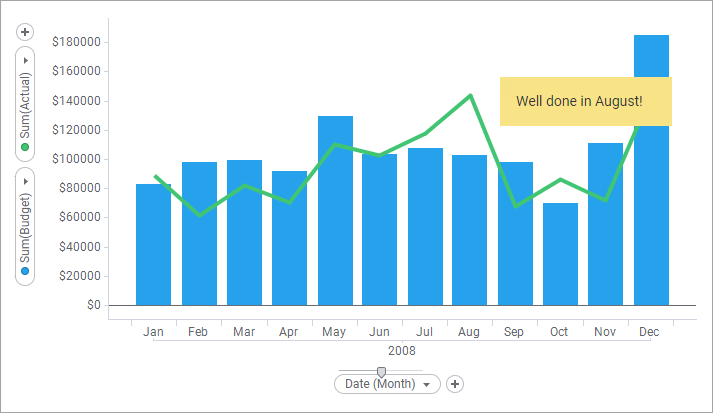
To add an annotation, select Visualizations > New annotation... on the menu bar. An annotation example is shown below.
The annotation is a part of the visualization. This means that a move of a visualization to another position in the analysis, or a duplication, includes also added annotations. If you export the visualization, you specify whether or not the annotations should be included.
The position of an annotation can be changed. You simply click and drag it to the wanted position within the visualization, or to another visualization on the page.
If you do not want the annotations to be visible all the time, you can either hide them totally or minimize them to icons. A minimized annotation is shown below.
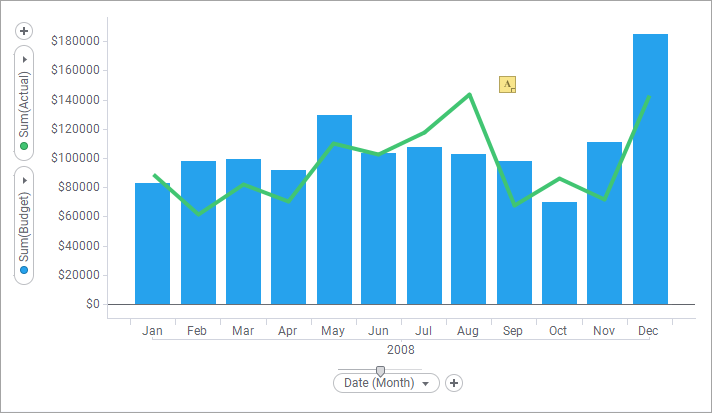
When an annotation is minimized, you can view the content in its tooltip.
See also: