The default titles for new visualizations varies with the visualization type, and sometimes also with the configuration of the visualization. When the 'Auto Title' option is used, the title of a visualization changes when you configure the visualization differently. If you want a different title, you can specify it in the visualization properties.
If you want the titles of pages and visualizations, or the visualization descriptions, to be set to change with the selections done on the visualization axes, you can define the title or description to use the built-in "axis visualization properties" or by setting up custom document properties to be used in the title or description. Document properties can, in turn, be controlled via property controls in the text area.
Note: If you have specified a dynamic title or description and then change the setup of the visualization by removing all columns from an axis included in the title or description, you may end up with unexpected blank sections in the title or description. Try to consider how you and other users of the analysis intend to modify the visualization before you specify what to include.
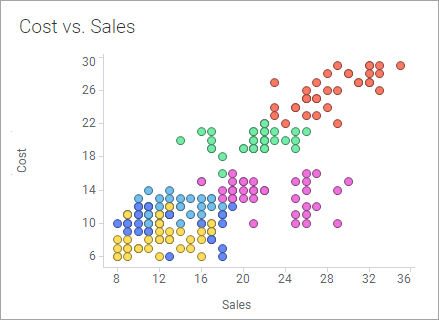
Example – The Default Scatter Plot Title:
The default title of a new scatter plot is constructed by the display names used on the axes of the visualization:
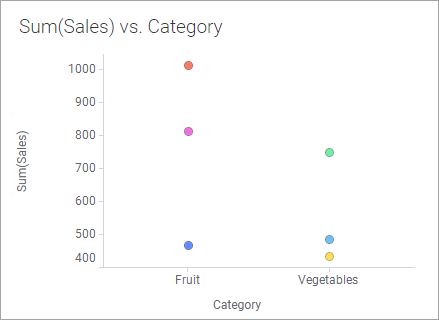
When the axes are changed, then the title of the visualization is automatically updated:
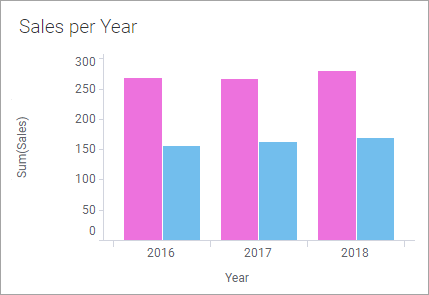
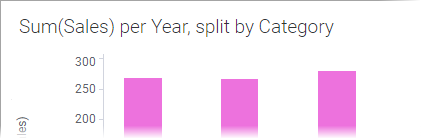
Example – Setting Up a Custom Dynamic Bar Chart Title:
The auto title for a new bar chart visualization with the following configuration is 'Value axis column name' per 'Category axis':
However, you might want to use another dynamic title instead, which contains the display names used on the axes of the bar chart as well as the categorization on the color axis. Right-click on the visualization and select Properties from the pop-up menu. On the General page, click Edit....
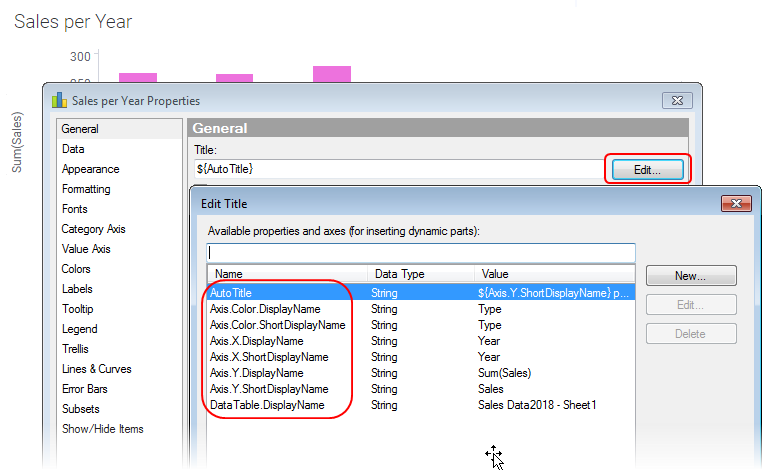
Here, you can select the properties of interest and insert them into the Title expression field. You can also type additional information in plain text. For example, the following expression includes the display names for the X- and Y-axes and also the color axis:
${Axis.Y.DisplayName} per ${Axis.X.DisplayName}, split by ${Axis.Color.DisplayName}
This would result in the following title, using the same visualization setup as above:
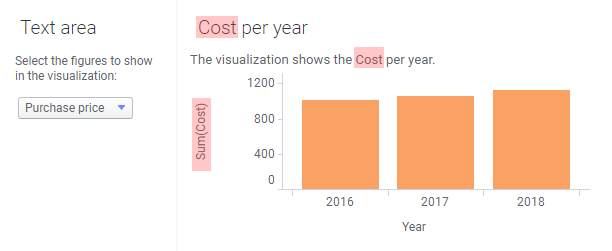
Example – Dynamic Description Updated Using a Property Control
If you are using custom properties to control what is shown in your analysis, you can also let the current property value be a part of the title or description of a visualization. In this example, a document property called MeasureColumnSelection has been used to set what is shown on the Value axis of a bar chart. A property control in the text area allows you to change the value of the property:
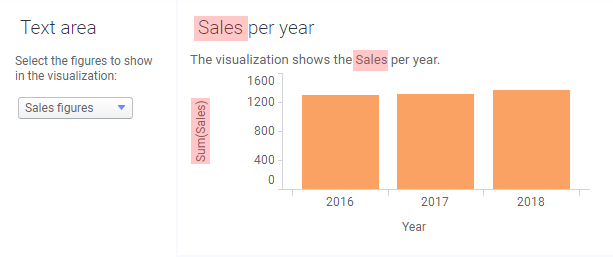
When the value of the property is changed using the property control, the visualization is updated:
The expressions used in this visualization were:
On the Value axis: Sum($esc(${MeasureColumnSelection}))
Title expression: ${MeasureColumnSelection} per year
Description expression: This visualization shows the ${MeasureColumnSelection} per year.
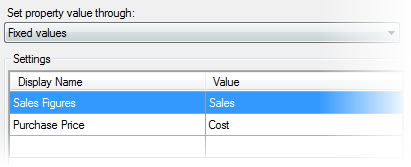
And the property control used fixed values with display names:
See also:
Working with Dynamic Titles and Descriptions
Visualization Properties in Expressions