Specifying What to Export
What is currently visualized in an analysis can be exported
easily to a PDF document using the Export to PDF
dialog. You can export the entire analysis, single visualizations, single
or specific pages, Details-on-demand, and reports that have been prepared
in advance. The preview updates dynamically according to your specifications.
To export the entire analysis:
You can export the entire analysis to a PDF document. Each
page in the analysis corresponds to a page in the created PDF document.
To open the Export to PDF
dialog, select File > Export > To PDF
on the menu bar.
Beneath What to export,
make sure All pages is selected.
If you want, use the general
settings in the dialog to modify the PDF output.
Click Export.
To export a visualization:
You can do a direct export of a single visualization resulting
in a PDF page that contains what is currently visible. It is possible,
though, to decide whether or not the visualization title, the legend and
any axis selectors should be visible on the PDF page.
Note: In case the entire visualization
is not visible in the analysis (and for that reason a scroll bar is added
to the visualization), you can, in the export, either include only what
is visible following the procedure below, or include also what is not
visible. See To
export a visualization and include non-visible content.
In the analysis, click the
visualization that you want to export to a PDF document.
Response: The visualization becomes the active
visualization.
To open the Export
to PDF dialog, select File > Export
> To PDF on the menu bar.
Comment: You can also access the dialog by right-clicking
the visualization. In the opened menu, select Export
> Visualization to PDF.
Beneath What
to export, make sure Active visualization
is selected.
If you want to Show
visualization title , Show legend
or Show axis selectors, make sure the
corresponding check boxes are selected.
Comment: To export only what is visible in a tabular
visualization, clear the Export entire table
check box.
If you want, use the general
settings in the dialog to modify the PDF output.
Click Export.
To
export a visualization and include non-visible content:
Sometimes all the visualization content is not visible,
so scroll bars are added. For example, this might be the case for tabular
and trellised visualizations. The content that is not currently visible
can be included in the export as well.
Comment: When exporting a KPI chart, you can export only
what is currently visible.
In the analysis, click the
visualization that you want to export to a PDF document.
Response: The visualization becomes the active
visualization.
Select File
> Export > To PDF on the menu bar to open the Export
to PDF dialog.
Comment: You can also access the dialog by right-clicking
the visualization. In the opened menu, select Export
> Visualization to PDF.
Beneath What
to export, make sure Active visualization
is selected.
To export also what is not
visible in the visualization, select the Export
entire table check box for tabular visualizations, and Export all trellis pages for visualizations
trellised by page.
Depending on the type of visualization, and its
current configuration, you will see some of the check boxes listed
below:
Check box |
Description |
Show
visualization title |
Specify
whether or not the visualization title should be included
in the export. |
Show
legend |
Specify
whether or not the legend should be included in the export.
Consider clearing the check box if the
legend information is redundant, and if more space is wanted. |
Show
axis selectors |
Specify
whether or not the axis selectors should be included in the
export. |
Columns
first, then rows |
Visualizations
of table type that fill up more than one PDF page are by default
exported so that rows are exported first followed by the columns:
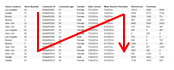
Select this check box to instead export
columns first followed by rows:
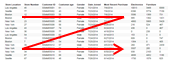
|
Repeat
column headers |
For
visualizations of table type, select this check box to display
the column headers on each PDF page on which the visualization
continues. |
Repeat
row headers |
For
cross tables, select this check box to display the row headers
on each PDF page on which the visualization continues. |
Keep
hierarchy levels together |
Select
this check box to, as far as possible, display items on the
lowest level in the hierarchy on the same PDF page. |
Repeat
frozen columns
|
If
columns are frozen in a table visualization, select this check
box to display these columns on every PDF page on which the
table visualization continues. |
If you want, use the general
settings in the dialog to modify the PDF output.
Click Export.
To export a single analysis page:
Click the page tab whose visualizations
you want to export.
Select File
> Export > To PDF on the menu bar to open the Export
to PDF dialog.
Comment: You can also access the dialog by right-clicking
the page tab and selecting Export > Page to
PDF in the opened menu.
Beneath What
to export, make sure Current page
selected.
Comment: If the analysis page contains more than
one visualization, it is possible to export the visualizations to
separate PDF pages. Select the Create one PDF
page per visualization check box.
If you want, use the general
settings in the dialog to modify the PDF output.
Click Export.
To export specific analysis pages:
Using the option All pages,
you export the entire analysis. However, it is possible to make a selection
of which pages to export.
Select File
> Export > To PDF on the menu bar to open the Export
to PDF dialog.
Beneath What
to export, select Specific pages.
In the text field, type the
numbers of the pages you want to include in the PDF document, for
example, 4, 5, 7-10, and press Enter. The page tab furthest to the
left in the analysis is page 1, the second left is page 2, and so
on.
If you want, use the general
settings in the dialog to modify the PDF output.
Click Export.
To export Details-on-Demand:
The data rows underlying what is marked in a visualization
are listed in Details-on-demand. These rows
can be exported.
Select File
> Export > To PDF on the menu bar to open the Export
to PDF dialog.
Beneath What
to export, select Details-on-demand.
Select the Export
entire table check box, if you want to include all the Details-on-demand content in the export.
You will see some of the check boxes listed below:
Check box |
Description |
Columns
first, then rows |
If
the Details-on-Demand table fills
up more than one PDF page, the rows are by default exported
first and then the columns:
Select this check box to instead export
columns first and then rows:
|
Repeat
column headers |
Select
this check box to display the column headers on each PDF page
on which the Details-on-Demand
table continues. |
Repeat
frozen columns |
If
columns are frozen, select this check box to display these
columns on every PDF page on which the Details-on-Demand
table continues. |
If you want, use the general
settings in the dialog to modify the PDF output.
Click Export.
To export a prepared report:
Select File
> Export > To PDF on the menu bar to open the Export
to PDF dialog.
Beneath What
to export, select Prepared report.
In the drop-down list, select
the report to export.
Click Export.
Tip: It is possible to export
reports also from a text area. For more information, see 'Add
an export report button, link or image action control to the text area'.