Option |
Description |
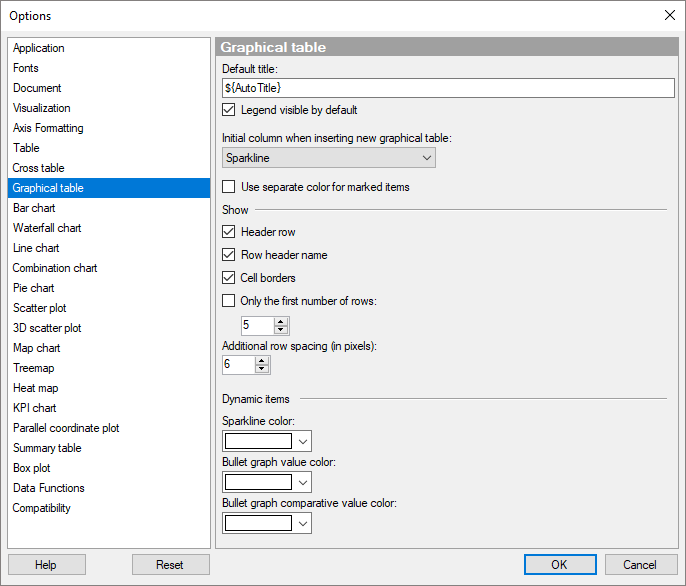
Default
title |
Specifies the default title for this visualization type. Tip: If you edit the title for a graphical table and you want to use that title expression in all new graphical tables, then you can click on the Set as Default button in the Edit Title dialog directly. |
Legend visible by default |
Specifies whether or not the legend should be open when creating a new bar chart. |
Initial column when inserting new graphical table |
Specifies the default column type to show up initially when inserting a new graphical table visualization. |
Use
separate color for marked items |
Select this check box to use a specified marking color (default is green) for marked items in this visualization type. If the check box is cleared, then unmarked items will be faded out instead. |
Show |
|
Header row |
Specifies whether or not the column headers at the top of the graphical table should be visible. Tip: If you want to show or hide a specific column header, instead of the entire row of headers, open the Settings dialog for the column of interest, go to the General page and then select or clear the check box Show name in header. |
Row header name |
Specifies whether or not the row header name should be visible. This is the left-most header in the header row, displayed above the column containing the row headers in the graphical table. By default, the row header name is the name of the column on the row axis. If the row axis has a hierarchy of columns, then the row header name is the column at the lowest level in the hierarchy. |
Cell borders |
Specifies whether or not cell borders should be visible in the graphical table. |
Only the first number of rows |
Select this check box if you want to display a limited number of rows in the graphical table. Note that the sort order in the graphical table affects which rows are shown. |
Additional row spacing (in pixels) |
Specifies how much extra space should be added to the cells for each row. |
Dynamic items |
|
Sparkline color |
Select which color should be used by default when creating a new sparkline. Note that this setting also affects new sparklines created in the text area. |
Bullet graph value color |
Select which color should be used by default for the value bar when creating a new bullet graph. Note that this setting also affects new bullet graphs created in the text area. |
Bullet graph comparative value color |
Select which color should be used by default for the vertical line representing the comparative value when creating a new bullet graph. Note that this setting also affects new bullet graphs created in the text area. |
Reset |
Resets all properties on this page to the default values. Note that an administrator can configure which settings should be default for certain user groups on the server. If you are a member of such a group, the options on this page will be set to these defaults when you press the Reset button. |
See also: