Option |
Description |
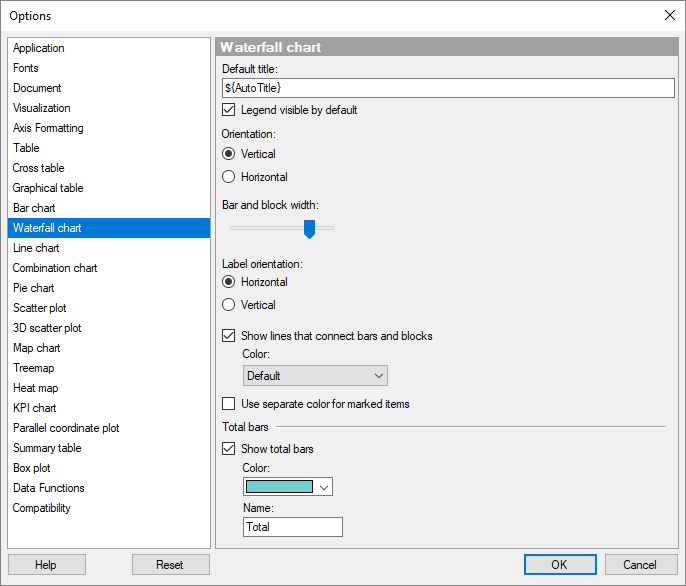
Default
title |
Specifies the default title for this visualization type. Tip: If you edit the title for a waterfall chart and you want to use that title expression in all new waterfall charts, then you can click on the Set as Default button in the Edit Title dialog directly. |
Legend visible by default |
Specifies whether or not the legend should be open when creating a new waterfall chart. |
Orientation |
Specifies whether the bars and blocks should be displayed horizontally or vertically by default. |
Bar
and block width |
Drag the slider to modify the default width of the bars and blocks. |
Label
orientation |
Specifies whether labels should be displayed horizontally or vertically by default. |
Show lines that connect bars and blocks |
Select this check box to display transition lines between the bars and the blocks when creating a new waterfall chart. |
Color
|
Use the color palette to specify a color of the transition lines that is different from the default color. |
Use
separate color for marked items |
Select this check box to use a specified marking color (default is green) for marked items in this visualization type. If the check box is cleared, then unmarked items will be faded out instead. |
Total bars |
|
Show total bars
|
Specifies whether or not total bars should be shown by default. A total bar can represent the resulting value for an entire waterfall or an intermediate running total. |
Color
|
In the color palette, specify the color of the total bars. |
Name
|
In the text field, type the default scale label for the total to be displayed on the category axis. |
Reset |
Resets all properties on this page to the default values. Note that an administrator can configure which settings should be default for certain user groups on the server. If you are a member of such a group, the options on this page will be set to these defaults when you click the Reset button. |
See also: