Option |
Description |
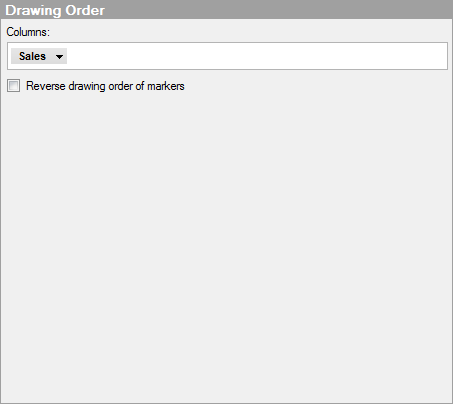
Columns |
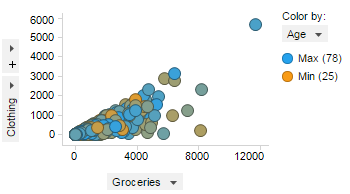
Specifies the column to use for defining the drawing order of markers. When markers cover each other, partly or totally, it can be useful to define an order in which markers are drawn. Then markers of certain interest can be brought forward in the visualization and the other markers backwards. In the scatter plot below, the default drawing order is used when drawing the markers, and they are placed on top of each other. The markers are colored by the Age column, and they shift gradually from blue to orange, representing ages from 78 to 25.
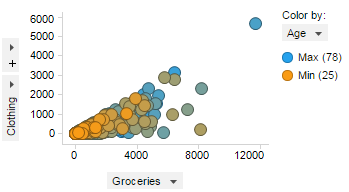
Below the drawing order column is set to Age. The scatter plot is drawn starting with the orange markers at the bottom and ending with the blue markers on top, that is, markers representing higher ages are more visible.
Comment: The order in which the column values are sorted can be changed, For more information, see Column Properties - Sort Order. Tip: If you have added coloring rules, for example assigned top values a certain color, consider specifying the column on the color axis also as drawing order column. These top values will then be drawn on top and do not risk to be covered. |
Reverse
drawing order of markers |
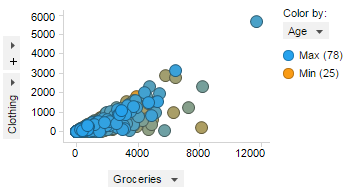
(The check box is only available if a drawing order is defined.) Draws the markers in the opposite order (for the column specified above). That is, front markers are sent backwards and vice versa. Reversing the drawing order in the scatter plot above will draw the blue markers first and the orange markers last, that is, markers representing lower ages are more visible.
|