Analyzing Marked Data
You can mark data that you are particularly interested
in and then explore it from different perspectives. For example, you can
view the details of the marked data in Details-on-Demand,
or you can create details
visualizations.
Another perspective to explore the marked data from is
to look for relationships to other variables in the data. You might want
to, for example, examine whether there are differences between the marked
data and the unmarked data, or find out if the marked data correlates
to certain variables in the data. Visualizations that inform of such relationships
can be suggested by the recommendation engine, and you can use these visualizations
to get ideas on how to proceed the exploration to get further understanding
of the data.
To get these visualizations showing relationships, you
do as follows:
In the visualization, mark
the data you are interested in.
Click Recommendations
based on marked data  that becomes available in the visualization title bar. Alternatively,
right-click the visualization and select Analyze
marked data in the menu.
that becomes available in the visualization title bar. Alternatively,
right-click the visualization and select Analyze
marked data in the menu.
Comment: The action initiates calculations in the
recommendation engine. For big data tables, the calculations might
take some time.
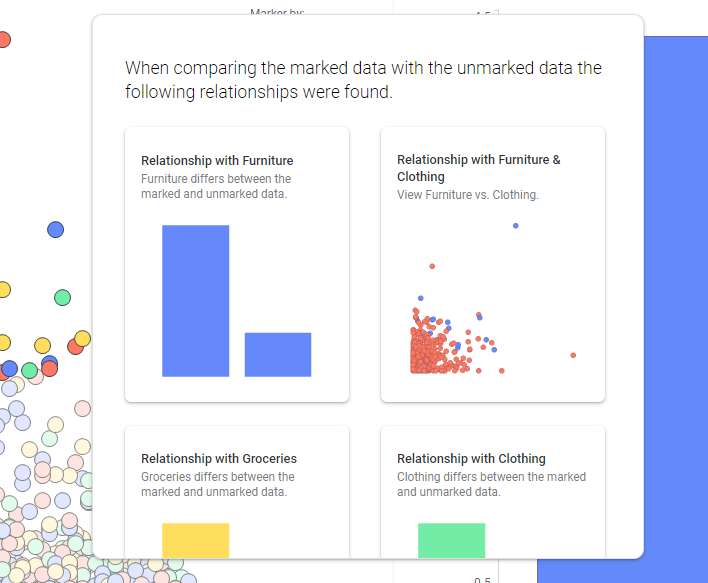
Response: If the calculations discover there are relationships between
the marked data and the unmarked data, these relationships are presented
to you in the shape of various visualizations.
Note: Avg (average) is
the default aggregation in the visualizations showing relationships.
Drag the visualizations, which
contain relationships you want to examine closer, to the analysis.
Comment: A new column called 'Marked + a time stamp'
consisting of the values 'Marked' and 'Unmarked' is added to the data
table.
Explore the relationships
in the added visualizations.
Tip: Some columns in the data
table might be irrelevant to include in the calculations. Then you can
exclude them before clicking Recommendations based
on marked data . Open Data in analysis, right-click
the column you want to exclude, and in the Include
in recommendations drop-down menu, select No.