This dialog is available for visualizations with more than one scale and allows you to specify the range that you want to show for the specified scale.
To reach the Scale Range dialog:
In the Visualization Properties dialog, go to the axis page that displays the Dual scales or Multiple scales settings.
If Dual scales is used, click Scale Range below the Left axis or the Right axis. If Multiple scales is used, select which scale to define scale range for from the drop-down list under Individual scale settings. You can also select All scales to set the same range for all the scales, then click Scale Range to the right of the drop-down list.
Option |
Description |
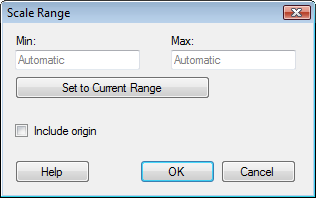
Min |
Leave the field blank (Automatic) to let the application automatically adjust the scale range after the currently lowest value used on the axis. |
Max |
Leave the field blank (Automatic) to let the application automatically adjust the scale range after the currently highest value used on the axis. |
Set
to Current Range |
Allows you to set the scale range to the currently filtered values. |
Include
origin |
[Available for continuous axes only.] Always includes the value 0 on the axis, regardless of filtering. |
If a range has been specified, further filtering will not affect the range of the selected scale. However, when all values belonging to a certain scale have been filtered out, the scale will become hidden.