The Data canvas (the source view) shows how data has been added to the data table, and whether any other modifications have been done to obtain the final data table. Each object in the upper part of the data canvas is called a node, and it represents either a data source or an operation where data from two sources have been combined. In the source structure, you can click on different nodes to see what has been done with the data in that step. This can help you get an insight in how the final data table, used in the analysis, was created. The final data table node is always available in the upper right of the data canvas.
You can also use the data canvas to change settings for different nodes or operations, or to reload data from different sources.
To show or hide the data canvas:
On the authoring bar, click Data
canvas ![]() .
.
Note: The toolbar at the top of the data canvas always applies to the final data table, and not to the selected node in the graphical structure. This means that a replace operation from the toolbar will replace everything done with the data table, up until the final node. Click on a data source node and select Replace data source from the 'Loaded data' step in the lower part of the source view to switch an individual data source. Similarly, 'Delete' on the toolbar will remove the entire data table. To remove a separate node (data source), click the Remove icon on the node of interest instead.
In this example, a data table has been loaded from Salesforce and more rows and columns have been added to the original data table from data files.
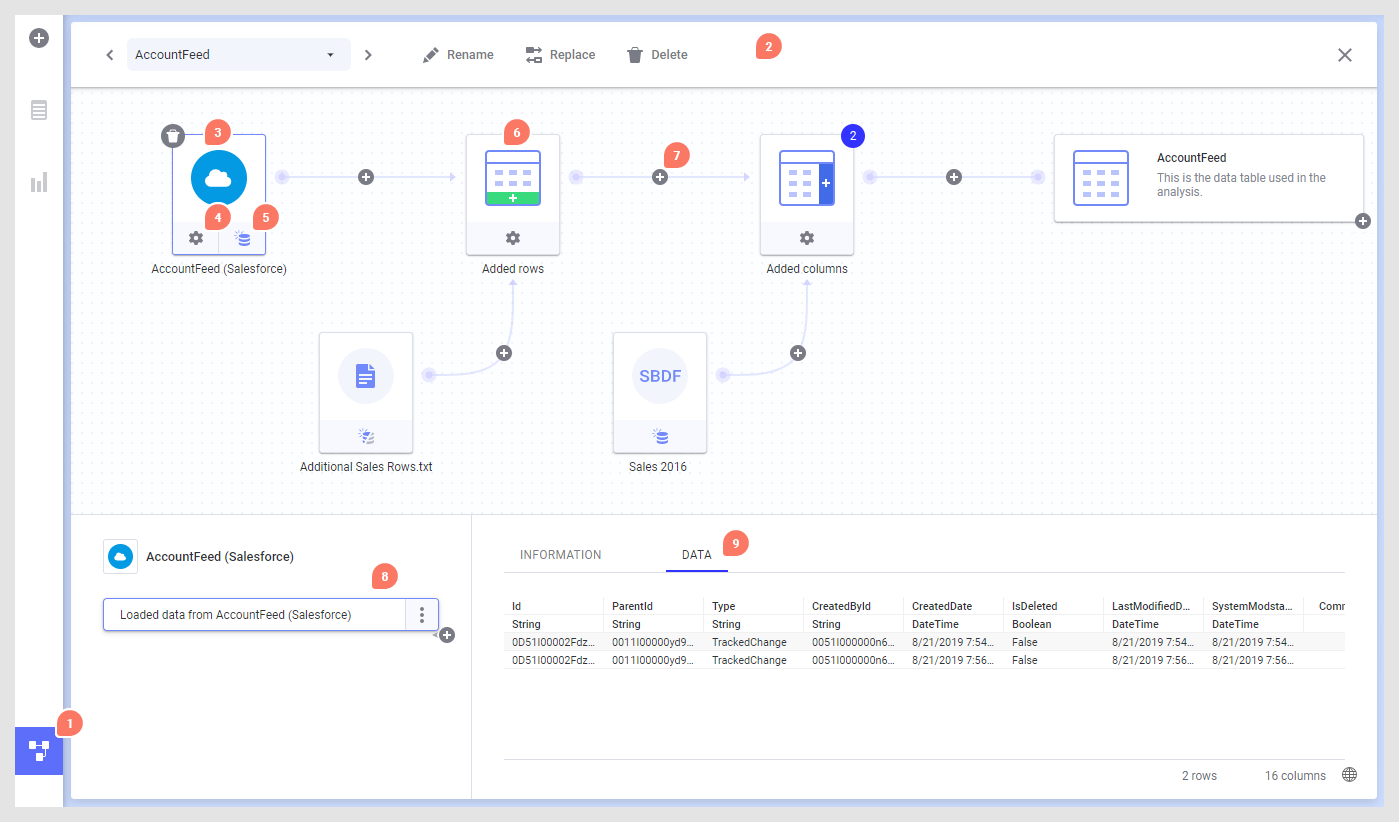
1. Switch between the data canvas and the visualization canvas by clicking the Data canvas icon on the authoring bar.
2. The toolbar at the top of the data canvas shows which data table you are looking at and it contains tools that work on the entire data table, such as Rename, Replace and Delete.
3. Click on a node to view more information about that node in the fields below.
4. If the settings for the node can be changed, click the settings icon under the node to edit the node. See Editing a data connection, How to Edit Column Matching or Other Settings for Added Rows and How to Edit Column Matching or Other Settings for Added Columns for more information.
5. For some types of sources, you can change the Data loading settings by clicking on the button at the bottom of a node, and switching to a different setting:

Here, you can also reload linked data, for data sources where this is possible .
Note: Some nodes do not have access to the original source. In that case, the only option available will be Stored data. For example, this is the case when you have added data from the clipboard. See Embedded or Linked Data? for more information about data loading settings.
6. When more data has been added to the original data table, the data to add is shown as a separate node, and the original data plus the added rows or columns is shown in the Added rows or Added columns node.
7. You can add more rows or columns to a certain point in the data structure by clicking the plus sign between two nodes. Transformations added using the plus sign will end up as the last step on the node to the left of the plus sign. To add a transformation between existing step groups, see 8.
8. The field at the bottom left shows the list of step groups on the currently selected node, and, when applicable, provides an entry point for editing different parts of the data table. For example, you might replace a data source, add or edit transformations, edit on-demand settings or remove previously added operations. If there is an issue with an operation, you will be informed about this using icons and tooltips. If you want to add more rows or columns, or a new transformation group to a certain point in the structure, you can click the plus sign of interest and select the desired operation. Note that if you insert rows or columns between transformation groups in the list of step groups, any transformations below the insertion point will be moved to the new node in the data structure.
9. The field to the right shows details about the selected operation. For in-memory sources, click the Data header to see a preview of the data the way it looks after the steps in the selected step group have been applied. You can also see the number of rows and columns in the data at this stage, which makes it possible to investigate whether data has been added in the expected way.
The node to the far right represents the final data table, the way it is used in visualizations in Spotfire.
See also: