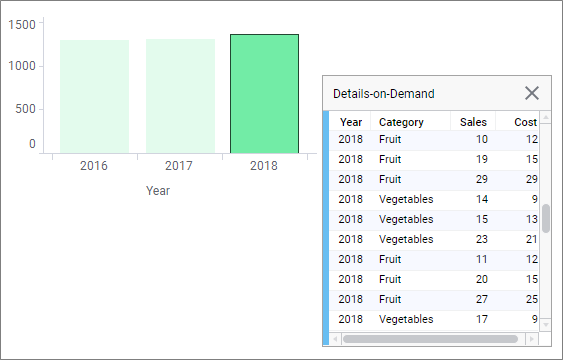
The Details-on-Demand displays the actual values of marked items in the active visualization. If you mark a bar in a bar chart, all the rows of data included in that bar are presented. Marking a record in a scatter plot might only display information about a single row of data.
You can view and manage Details-on-Demand in a popover or in a docked panel. Select View > Details-on-demand on the menu bar to open it. It will open in the mode it was opened last time.
The Details-on-Demand works just like any other table—you can click column headings to sort the presented details, drag and drop column headings to change the order, and change the width of the columns by moving the mouse over the column separator line and dragging.
If more than one data table is available within the analysis, a color stripe showing the relations color for the active data table is shown on the left hand side of the Details-on-Demand.
Note that when a visualization combines data from more than one visualization, the Details-on-Demand will show data from the main data table only.
Note: For analyses with multiple data tables, settings for the Details-on-Demand must be defined in the Details-on-Demand properties dialog for each data table.
As long as you work with imported data and you use the Details-on-Demand to view information about more than one row, you can also use the Details-on-Demand as a starting point when replacing values in a data table.