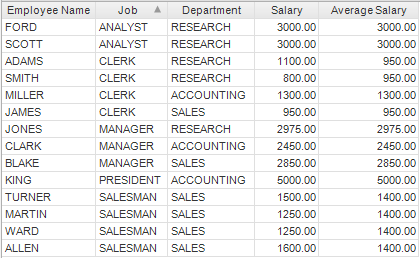
There may be situations where it is necessary to use more than one column to group by when an aggregated column is calculated. In the following table, for example, we can compare the salary of each employee with the average salary of employees at the same department and job.
To produce this table, we must define the Average Salary column with two group by expressions: Job and Department.
To use multiple group by expressions:
In Information Designer, select a value column from the Data Sources tree, for example Salary.
Click the topmost Add > button.
In the Expression
field, type:
AVG(%1)
Comment: AVG is the average function. You can find more aggregate functions here.
In the Group
By section, click ![]() to show the group by
controls.
to show the group by
controls.
Click New to add a new Group by expression.
From Data Sources, select the first column to group by (for example Job).
Click Add > in the Settings field.
Click New to add a second Group by expression.
Select the second column to group by (for example Department).
Click Add >.
Click Save.
Response: The resulting column will consist of the average of the value column, for each value in the group by columns.
Note: It would not have been possible to produce the table above using the Drillable option. If the Average Salary column element had been drillable, it would have appeared identical to the Salary column, since the Employee Name and Salary columns would also have been used to group by.