Column references
Accessing columns is done by enclosing the column name in "[" and "]" characters (square brackets). The brackets are needed when the column name contains characters other than letters, digits or _ (underscore). They are also required when the column name is the same as a function name, or when the column name begins with a digit. If a column name contains any square brackets then they must be escaped. Escaping of brackets is performed by adding extra brackets before and after the bracket: "[" and "]]". For example, if the column name is [Name], it would be written as [[Name]]] in an expression.
If the column name has no special character or whitespace, or is not also a function name, it can be entered without brackets.
Examples:
Column1
[Column1]
[Binned Column1]
[1]
[!@#$%^&*()[\]]\\]
Constants are converted to columns, so even if a method says that the argument has to be a column, it is acceptable to use a constant.
Case sensitivity
Variables, functions and keywords are not case sensitive: SUM(C1) = Sum(C1) = sum(C1)
Column name references are case sensitive.
Method call names are not case sensitive. All methods which are defined in the add-in framework can be used. See later sections for information about the different methods supported.
Expression results
An expression describes how a new column should be calculated. The newly created column will have the same number of rows as all the other columns in the data table. The default null handling behavior is that operations on null return null. This means that if a new column is calculated as [Column A]*2 and there are empty values on some rows in Column A, then the new column will have empty values on those rows as well.
Multiple columns are normally separated by a comma. If multiple expressions are used the AS keyword can be used to rename the expressions in the custom expression dialog. See examples at the bottom of the page.
Comments in expressions
If you create more complex expressions that need an explanation, it is possible to add comments to the expressions. Use '//' to specify that the text after the symbols is a comment.
For example:
Avg([Sales]) OVER Intersect([Cat], AllPrevious([Year]))
//Shows the average sales per category for all years, up until the current year.
Note that if you add comments to an expression on a visualization axis, it is expected that you continue using the custom expression dialog for all further editing. This is because the drag-and-drop operations affect and rearrange the expressions too much to be able to keep comments.
Categorical expressions, NEST and CROSS
In custom expressions, categorical and hierarchical columns and expressions are written between angles, "<>". When more than one category is available within the expression, which combinations of categories to show must also be specified. This is done using the keywords NEST (which shows all actual combinations of values in the data) or CROSS (which will show all possible combinations of the values, including combinations that currently hold no data). All columns in the expression must be separated by "nest" or "cross" instead of a comma, and mixing the two combination options is not permitted.
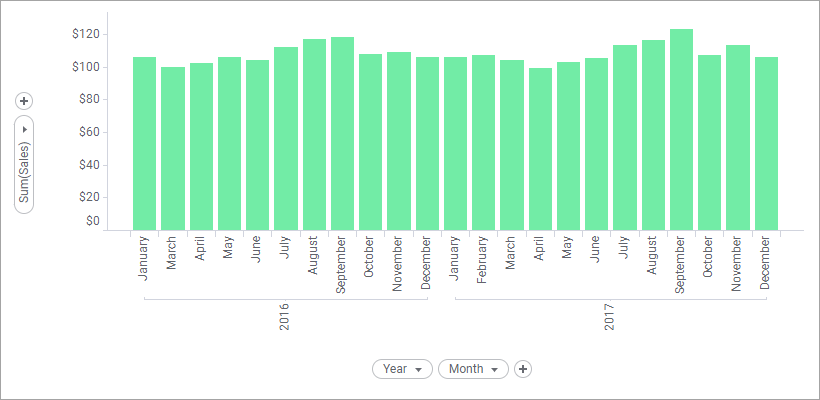
For example, if we have a data table containing some sales data for each month during two years, but the data for February is missing for 2016, the different options will give the following results:
Nest:
Since there is no data available for February 2016, there will not be a bar (nor a placeholder for a bar) there. This visualization is set up using the All values in data (nest) option in the Advanced Settings dialog, reached from the category axis property page for the visualization. It corresponds to the custom expression: <[Year] NEST [Month]>
Cross:
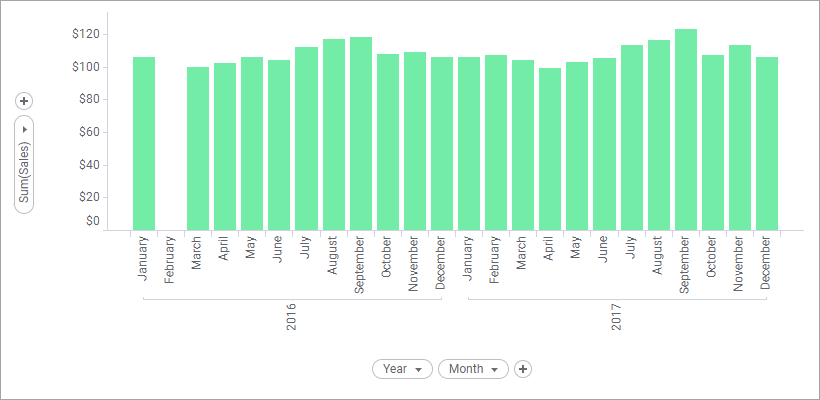
When the CROSS option is selected, all possible combinations of the categories are displayed. This means that there will be a placeholder for the February column for 2016, even though there is no data available for February. The All possible values (cross) option has been selected in the Advanced Settings dialog and the corresponding custom expression would be: <CROSS [Year] CROSS [Month]>
(The first CROSS is optional.)
Note: Even though the CROSS option is selected, you may not see the empty categories in the visualization depending on your Categories settings for the axis. If "Show filtered values" is selected, then categories without any values will be hidden in the visualization. You need to use "Show filtered range" or "Show all values" to see the empty category in this example.
Examples of expressions:
[Column1]
[Column1], [Column2]
[Column1] AS [My first column], [Column2] AS [My second column]
<[Category column 1]>
<[Category column 1] nest [Category column 2]>
123.23
39+12*3
-(1-2)
cast (power(2,2) as integer)
null
case Column1 when 10 then 'ten' else 'not ten' end
case when 1 < 3 or 3 < 2 then 10 else 32 end
case when Column1 is not null then Column1 else Column2 end
[Sales]/1000 //The sales figure has been divided by a thousand to show values in kkr instead of SEK
Note: There is a limit to how complex an expression can be when it comes to the depth of nested functions. This limit is there to prevent stack overflow errors and instabilities.