Example 1
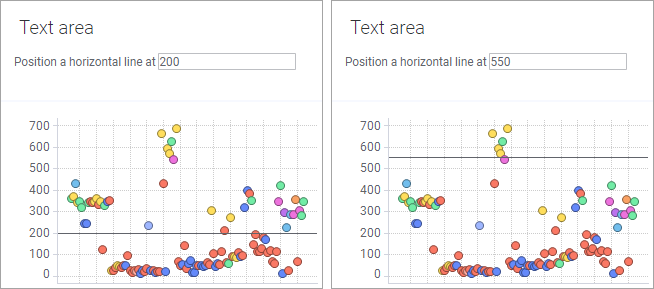
The first example describes how to make it possible to control the position of a horizontal line from a text area, as shown below.
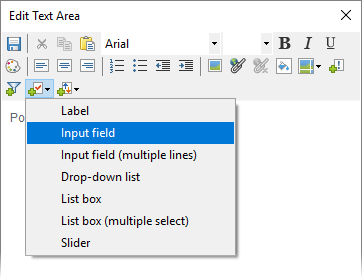
Insert the property control, an Input field, into the text area.
The Property Control dialog opens, where you create the property via New. You give it a name, specify its data type, and a starting value.
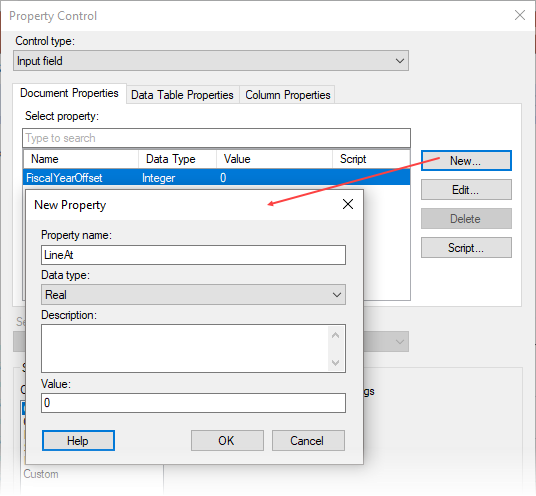
Once the property is created, you can adjust the formatting of the values at the bottom of the Property Control dialog.
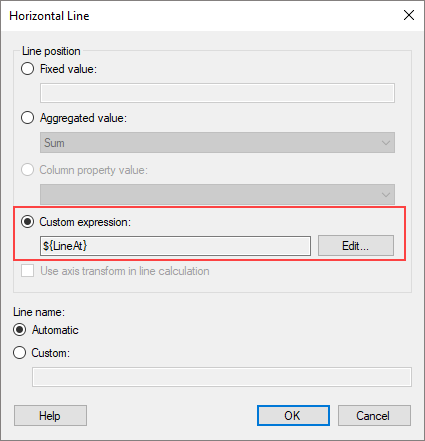
The next step is to connect the created property to the setting that should be affected by the property value. In this case, the setting is found on the Lines & Curves page in the visualization's Properties dialog. On the Lines & Curves page, select Add > Horizontal Line > Straight Line to open the Horizontal Line dialog. Select the Custom expression option, and, via Edit, enter ${LineAt}, which is the syntax used when adding the value of the property as text in an expression (and also the default if you double-click the property in the Available properties for column list).
Then, make sure the check box is selected for the horizontal line under Visible lines and curves on the Lines & Curves page, and you are done.
Example 2
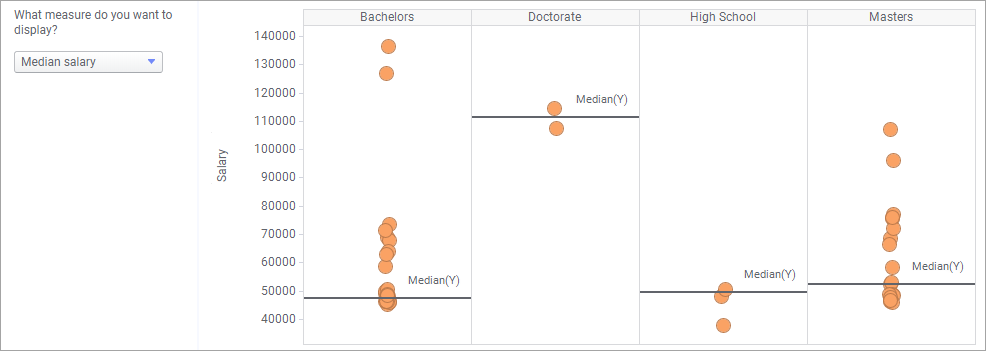
The scatter plot below displays salaries for employees, trellised per education level. The text area contains a property control in the form of a drop-down list, where a dashboard user can select to add horizontal lines that show either the average, the median, or the most common salary within each education level.
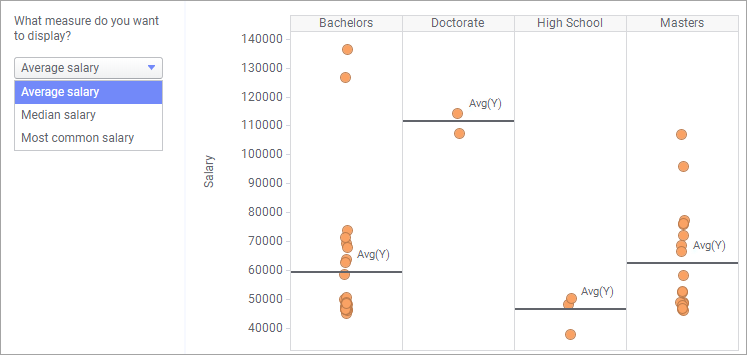
To configure what is shown above, do as follows:
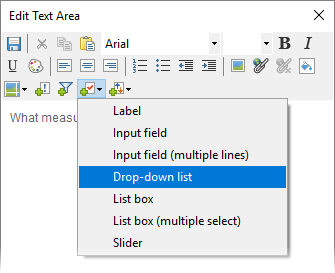
First, insert the property control into the text area.
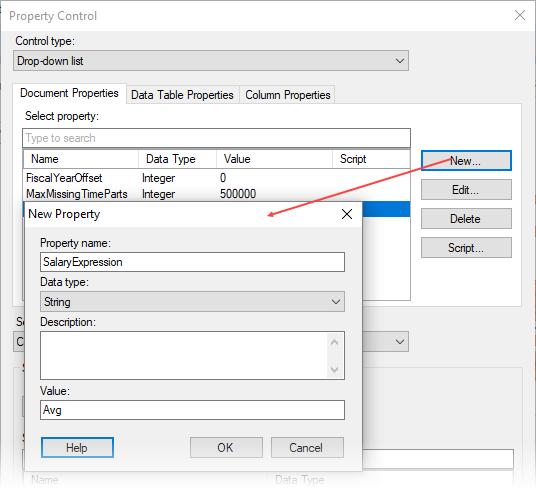
This opens the Property Control dialog, where the items that should be available for selection in the drop-down list are defined. However, the actual property to be controlled does not yet exist. To create it, click New to open the New Property dialog, where you give the property a name and specify its data type and start value.
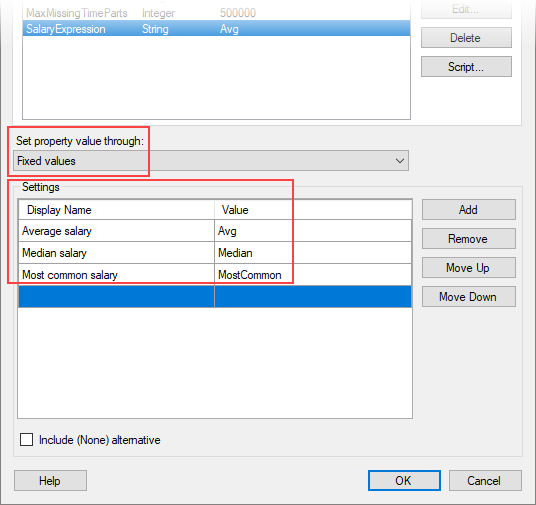
Now that the property exists, define which values to include in the drop-down list. In this example, you define Fixed values yourself, by typing the text to show under Display Name, and by adding their values to the right.
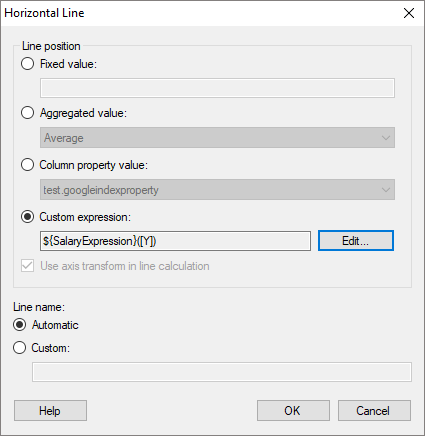
The last step is to connect the property to the place that should be affected by the selected property value. In this case, it is the Lines & Curves page in the Properties dialog. On the Lines & Curves page, click Add > Horizontal Line > Straight Line to open the Horizontal Line dialog. Select Custom expression, followed by Edit to open the Custom Expression dialog. In the Custom Expression dialog, enter ${SalaryExpression}([Y]), where SalaryExpression is the property you have created (the result of the custom expression ${SalaryExpression}([Y]) will, depending on the selection in the drop-down list, be Avg([Y]), Sum([Y]), or MostCommon([Y])).
Close the dialogs, and you will now be able to select where a line should be drawn in the visualization, by making a choice in the drop-down list. For example, in the image below, Median salary is selected.
See also: