On the authoring bar, click
Files and data  .
.
In the Files and data flyout, locate the data source (a data connection or an information link ) of interest by searching for a suitable keyword or by browsing the different categories.
When you have selected your data, you will see a summary view showing how the data will be added; the Add data to analysis summary. Click on the new data to enable editing of the settings. Make sure that the new data is added as a new data table, if this is what you want.
From the drop-down list, showing Import or External, select On-demand.
Click Configure.
Response: The On-Demand Settings dialog is displayed.
In the Define input for parameters that should control loading list, click to select the column in the new data that contains the identifiers.
Click Define Input.
Response: The Define Input dialog is displayed.
In the Input for the selected parameter list, select Values from column.
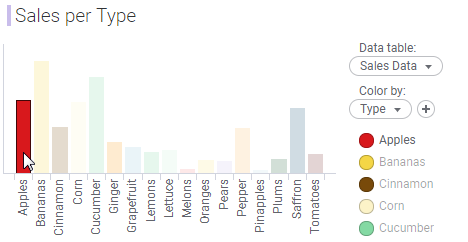
Select the Data table used by the master visualization.
Select the Column containing identifiers in the master data table.
Make sure that the Marked rows check box is selected and that only the check box for the marking used in the main visualization is selected.
Click OK to close the Define Input dialog.
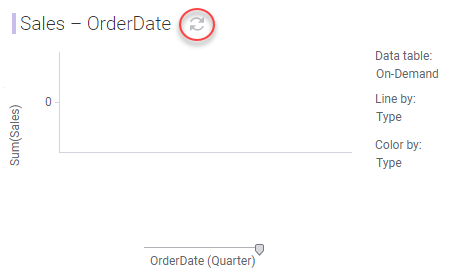
Use the Load automatically check box to determine whether to reload data as soon as the input conditions change or using a manual update only.
Comment: This setting can be changed later on in the Data Table Properties dialog or from the Data canvas.
Click OK to close the On-Demand Settings dialog.
Comment: You might also want to add a relation between the two data tables, so the marked rows from the master data table also become marked in the on-demand data table visualizations. This can be done later from the Data Table Properties dialog. See Data Table Properties - Relations for more information.
Click OK.
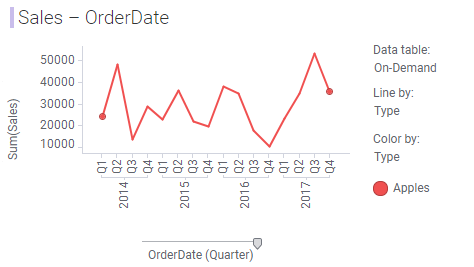
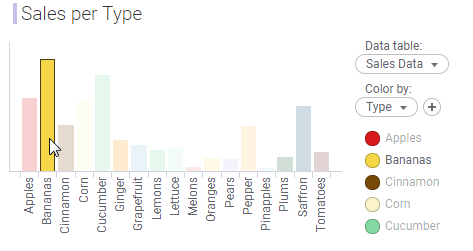
Response: The on-demand data table is loaded. The data shown in any visualization based on the on-demand data table will depend on what is marked in the master visualization.