What is a Cube?
An OLAP (Online Analytical Processing) cube is a multi-dimensional representation of data.
The OLAP cube consists of a set of measures (or facts) and a number of dimensions.
Dimensions organize the data for a user in relation to an area of interest, such as customers, stores, or geographies. Dimensions are usually hierarchical in nature. Measures (facts) reside in the intersections between the dimensions. As such, the measures or facts are aggregated by the cube itself (either beforehand, or, they are dynamically calculated).
This differs from relational databases where the measures or facts are stored in the database table and you apply aggregation methods when the database table is queried.
Cube Example
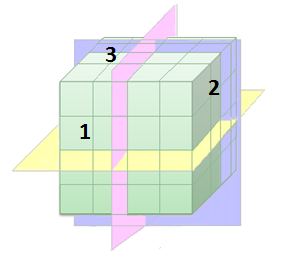
In the schematic image above, the sides of the cube could be said to represent different dimensions and the cell contains the associated measure.
As a simplification, if side 1 represents product type, side 2 is a time unit, and side 3 is region, then the cube could be queried in several different ways: the yellow plane could mean "Show sales per product for different years.", the pink plane could mean "Show sales per product in different regions." and the blue plane "Show sales per region for different years.".
In Spotfire, an OLAP cube is represented as a table. If you are new to Spotfire, a good starting visualization to use is the cross table visualization (also known as a spreadsheet).
What are Measures?
Measures is a general name for measurements, metrics or facts which are of interest in the data analysis. Measures are mostly numerical in nature. Examples of measures are sales, quantity, accounts, and so on.
A measure value is computed for a given point or cell by aggregating the data corresponding to the respective dimension intersection for the cell.
In Spotfire, each measure is represented as a column. Such a column is generally what you would put on the value axis of a visualization. Since measures are calculated by the OLAP cube you cannot change the aggregation method for measures in Spotfire.
In SAP BW, measures are referred to as 'Key Figures'.
What is a Dimension?
Dimensions organize the data in relation to an area of interest. Dimensions can be things like customers, stores, or geographies, and they are usually hierarchical in nature.
Different OLAP cube systems see dimensions differently. Some systems see dimensions as a container for related area of interests (for example, where the Customer dimension contains Occupation and Gender hierarchies), whereas other systems see dimensions as hierarchies. For systems that see dimensions as hierarchical, each dimension implicitly becomes a hierarchy.
In Spotfire, dimensions cannot be put in a visualization. They are a way to organize related data and can be seen in the Data in Analysis flyout and in the Views in Connection dialog, as a means of finding relevant data. Instead, it is the hierarchies that are used on axes in Spotfire visualizations.
SAP BW distinguishes between 'Key Figures' and 'Characteristics'. Key figures become measures in Spotfire, and all characteristics will be found in the 'Characteristics' dimension.
In Oracle Essbase, all dimensions are hierarchical in nature. In Spotfire, the Essbase dimensions are all shown as hierarchies.
What is a Hierarchy?
A hierarchy defines a set of parent-child relationships. Typically, a parent member belongs to a more general concept than its children and the parent member "summarizes" its children. Parent members can further be aggregated as the children of other parents.
A hierarchy can also be viewed as a set of mappings from a set of low-level concepts to higher-level, more general, concepts. Each concept is given a name – its level name. The levels are ordered so that a "more general" level precedes a "less general" level.
Each concept or level consists of a set of values. The level values are called members. Each member has a name and a key where the key is guaranteed to be unique.
As an example, consider a 'Geography' hierarchy that has the concepts of 'Country' and 'City', where 'Country' is more general than City'. That is, the 'Geography' hierarchy has two levels 'Country' and 'City', where the 'Country' level precedes the 'City' level. There are two members; 'US' and 'Germany',
who belong to the 'Country' level and four members 'Boston' (whose parent is 'US'), 'Hamburg' (whose parent is 'Germany'), 'Berlin' (whose parent is Germany), and 'Berlin' (whose parent is US), who belong to the 'City' level.
Geographical hierarchy example.

Hierarchies are commonly referred to as categories in Spotfire. That is, hierarchies are generally what you would put on the categorical axis of a visualization. A hierarchy with only one (1) level is represented as a column in Spotfire. A hierarchy with more than one level is represented as a hierarchy in Spotfire.
Cube Queries
When working with in-database cube data, Spotfire creates MDX (MultiDimensional eXpression) queries that are sent to the cube query engine to get results back.
In an MDX query, all hierarchies in the cube matter, even if they are not specified in the query. If a hierarchy is not specified in a query, then the default member of that hierarchy is used. You can view this as an implicit slicing of the cube on the default member. The default member is usually a member that denotes "all possible items", but this is not always the case.
For example, if you have a cube that contains one measure ('Sales') and two hierarchies ('Time' and 'Countries') and you use Sales on one axis and Time on another axis in a visualization. The result you will get back is Sales over Time for all countries. If you are using a currency dimension or hierarchy, it is not uncommon that the default member is a specific currency and not "all currencies". That means that you will get the value (e.g., Sales) for the currency that is the default currency. If this is not what you want, then you should ask your cube administrator to change the default member in the cube (only possible in Microsoft SQL Server Analysis Services), or, provide a Spotfire filter for the currency hierarchy, where you can select which currency to display.
If you do not see any data in your visualizations, it could be that no data has been aggregated for the combination of default member or members and the specified hierarchies in the cube. A potential remedy to this situation is to explicitly slice or dice the cube by applying the appropriate Spotfire filter for the hierarchy or hierarchies where default members are used.
Theoretically, you could split a query enough to return the actual values from the underlying data warehouse, but the cube would still consider the query as aggregated.
In-database Cubes in Spotfire
Because cube data is already aggregated from the start, aggregations are not performed by Spotfire when working with in-db cube data. All aggregations that need to be done (if any) are pushed down to the cube query engine. Instead, Spotfire can be used as a way to display the related combinations of measures and hierarchies configured by the cube administrator.
By taking advantage of the natural structure of the cube you can make sure that you are viewing relevant data. The free-dimensionality of Spotfire does otherwise allow you to make combinations of measures and dimensions from the cube that do not always make sense, or lead to "The expression is not valid"- messages in the visualizations.
Each time you change what is shown on the axes in a visualization based on in-db cube data, or make a selection in a hierarchy filter or a check box filter, a request is sent to the cube to provide the selected data. This means that if you make many changes in Spotfire, many requests may be sent to the database instead of just the request for the final selection.
Spotfire uses a delay of about one second in order to see if there are any additional selections made in a filter before sending the request to the database. This means that you should try to make coherent changes in filtering in a steady pace and not pause for too long while selecting various check boxes. If you pause for more than about a second, the current filter selection will be sent to the cube which will start to provide the requested data. Making additional changes to the filter will send an additional request to the database, causing a higher workload on the database, as the first request might still be running.
See also:
Common Operations on Cubes and their Spotfire Equivalent
Working with Microsoft SQL Server Analysis Services