How to Use the Cross Table
To create a new cross table:
On the authoring bar, click
 to open the
Visualization types flyout.
to open the
Visualization types flyout.
Drag the Cross
table visualization to the wanted position on the analysis
page.
Response: A first attempt to set up a suitable
cross table is made..
Adjust the cross table to
display the categories and measures of your choice.
To set up the cross table:
From the Data
in analysis flyout, drag the column of interest into the cross
table.
Response: Three drop targets are shown.


Drop the column onto relevant
drop target. Using the first drop target will place the column on
the vertical axis, and the second drop target will place the column
on the horizontal axis. A column dropped on the third target will
be used for defining the actual numeric values inside the cross table.
Note: You can
also drag the columns to the column
selectors. This way you can set up hierarchies,
which is a very powerful feature in a cross table.
To set up a cross table with images from a binary
column on an axis:
Right-click the cross table
to display the pop-up menu.
Select Properties.
Click to go to the Axes
page.
On the Horizontal
or Vertical axis, click the column selector
and choose the column containing binary data.
Click Label
Rendering.
Make sure the binary column
is selected in the Column drop-down list
of the Label Rendering dialog (only applicable if you have selected
more than one column on the axis).
Change Show
as to Image.
Click OK.
To set up a cross table with images from the web
on an axis:
Right-click the cross table
to display the pop-up menu.
Select Properties.
Click to go to the Axes
page.
On the Horizontal
or Vertical axis, click the column selector
and choose the column containing the identifier to the image.
Click Label
Rendering.
Make sure the identifier column
is selected in the Column drop-down list
of the Label Rendering dialog (only applicable if you have selected
more than one column on the axis).
Change Show
as to Image from URL.
In the Label Rendering dialog,
click Settings.
Enter
the URL where {$} represents each cell value, so that the resulting
URL when the values from the identifier column replaces the {$} points
to your image. For example, if the images reside on a network drive
which is common for everybody in your company and the identifier column
contains the names of the images, then the URL to enter might be Q:\Images\{$}.
Click OK
twice.
To
display grand totals for rows or columns:
Grand totals for columns and rows are calculated using
the same aggregation or expression that is used for the calculation of
the cell values. The totals are not based on the aggregated values shown
in the cross table cells; they are by default based on the underlying
data table rows.
Note: There is an option, though,
to base a total on the aggregated cell values in the cross table. When
you use this option, the total is calculated as the sum of the cell values,
no matter expression used for the calculations of the cell values. See
'To display grand totals and subtotals as the sum of the cell values'
below.
Right-click the cross table
to display the pop-up menu.
Select Grand
Total for Columns or
Grand Total for Rows.
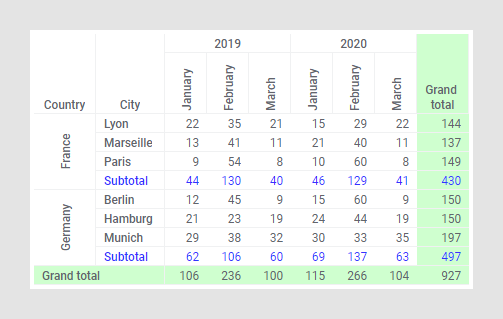
Response: The selected grand total is displayed
in the cross table, column grand totals at the bottom of the cross
table and row grand totals furthest to the right.
Comment: You can also make these selections on
the Totals page of the Cross Table Properties.
To
display subtotals for columns:
To display column subtotals, that is, partial summarizations,
in the cross table, the vertical axis must be set up as a hierarchy with
at least two levels. Subtotals are calculated using the same aggregation
or expression that is used for calculation of the cell values. The subtotals
are not based on the aggregated values shown in the cross table cells;
they are by default based on the underlying data table rows.
Note: There is an option, though,
to base subtotals on the aggregated cell values in the cross table. When
you use this option, the subtotal is calculated as the sum of the cell
values, no matter expression used for the calculations of the cell values.
See 'To display grand totals and subtotals as the sum of the cell values'
below.
Right-click the cross table
to open the pop-up menu.
Select Subtotals
for Columns.
Response: A submenu is opened. It lists the columns
and/or hierarchies levels you can display subtotals for on the vertical
axis. The options All and None are also available.
Select the columns (or levels
in a hierarchy) for which you want to show subtotals. Select All to display subtotals for all
the columns (or hierarchical levels) on the vertical axis.
Response: The selected subtotals are displayed
after the values in question.
Comment: You can also make these selections from
the Totals page of the Cross Table Properties. There you can also
specify the position of the subtotals; before or after the values.
To
display grand totals and subtotals as the sum of the cell values:
It is possible to base totals on the aggregated cell values
in the cross table. Then the totals will be calculated as the sum of the
cell values, no matter expression used for the calculation of the cell
values.
Right-click the cross table
to display the pop-up menu.
Select Properties.
Go to the Totals
page.
Beneath Display
totals, select the totals to be visible in the cross table.
If any subtotals are displayed,
select their position, Before values or
After values.
Settings
of calculations lists the expressions used for calculating
the cell values for the different expressions on the Cell values axis,
and what data the calculations are based on. Select, one at a time,
each expression, whose totals you want to calculate as a sum, and
then select As the sum of cell values
beneath Calculate totals.
Result: Any totals for the expressions selected
in the last step are calculated as sums. It is also indicated in the
list that they are calculated as Sum of cell
values.
To apply value-based coloring:
See Coloring
in Cross Tables and Heat Maps to learn how to set up coloring for
cross tables specifically. See Coloring
Overview if you want to learn more about coloring in general.
Note: The cross table can also
be styled with different text color and background color on specific headers,
columns, and rows without any connection to the cell values. See To_change_style_of_headers_columns_and_rows_in_a_cross_table.
To
change style of headers, columns, and rows in a cross table:
You can change the appearance of the cross table in many
different ways. For example, headers can be displayed horizontally or
vertically. By changing to a vertical header orientation for narrow columns,
the screen estate can be used more efficiently. You can specify the horizontal
and vertical alignment of the text, as well as bold and italic font style.
Text color and background color can be changed to highlight specific rows
or columns.
You can style all the headers on the same hierarchical
level, or an individual header. You can style an entire column or row,
as well as all the cell values in the cross table.
Click a header in the cross
table.
Response: A popover is opened. It contains styling
settings categorized in different sections for Header
and Values.
Hover the mouse pointer over
the Headers and Values
sections. The parts of the cross table that will be affected by the
selections you make, will be highlighted.
Tip: You can move the
popover out of the way if it hides the parts of the cross table that
you need to see when you are styling it. Just point the mouse cursor
at the top of the popover, then click and drag it to another position.
Make the styling selections
of your choice, then close the popover by clicking outside the popover.
Comment: Which styling settings are available in
the popover depends on which header you click. To reach styling settings
for the values, open the popover from one of the headers closest to
the values. For example Lyon, Hamburg, or March in the example above.
Alignment settings for the values are available from the headers on
the horizontal axis.
For more details on how to
style different parts of the cross table, see Styling
in the Cross Table.
To change the width of a separate column:
You can change the width of a column containing aggregated
values, and also the width of a column on the left of the aggregated values
columns.
For the column you want to
resize, place the cursor on the column divider to the right of the
column header.
Response: The cursor changes appearance.
Click and drag the cursor
horizontally to the wanted column width. A red, vertical line indicates
the width.
Comment: It is possible to specify an exact width
in pixels. Click the header, and in the opened pop-up menu, type the
wanted value in the Column width field.
Tip: To optimize the use
of the screen estate with all content kept visible, you can double-click
the column divider to adapt the column width to the content. Alternatively,
click the header, and in the opened pop-up menu, select Size
to fit. In a hierarchically structured cross table, this option
is only available for columns at the last hierarchy level.
To change the column widths of all columns simultaneously:
You can simultaneously change the column widths to the
same size, or to the smallest possible widths.
Place the cursor on any of
the column dividers between the column headers.
Response: The cursor changes appearance.
Press Ctrl,
and click and drag the cursor horizontally. A red, vertical line indicates
the width.
Response: The new column width is applied to every
column in the cross table.
Tip: To optimize the use
of the screen estate for the entire cross table, you can right-click
the visualization, and select Resize Columns
to Fit. This action will make each column width as small as
possible, that is, adjusted to the smallest size that keeps the content
of the cells and the headers visible.
To change row height:
Place the mouse pointer between
two rows in the cross table, press and hold the mouse button.
Adjust the height by dragging
the red line to the desired row height, then release the mouse button.
Response: The rows in the cross table adjust to
the new height.
Note: The heights of
header rows on the horizontal axis are adjusted separately, while
the rows containing cell values always have the same height.
To sort columns and rows in the cross table:
You can sort the aggregated values in the cross table columns
as well as in the cross table rows. The sorting can be done in ascending
or descending order. In hierarchically structured cross tables, the sorting
of values is by default applied within each of the smallest subcategories.
However, it is possible to perform a global sorting, that is, ignore any
specified hierarchy when sorting. See the next procedure, 'To sort globally
in the cross table'.
Click the header of the cross
table column or row whose values you want to sort.
In the opened pop-up menu,
beneath Sorting, click  to sort from lower to higher values, or click
  to sort from higher to lower values.
Response: The values are sorted, and an arrow in
the header indicates in which order.
Comment: You can click None
to return to the default order. Moreover, you can press Shift + click
the header to switch the sort order.
To sort globally in the cross table:
The values in a cross table can be sorted globally. It
means that the values are sorted regardless of any specified hierarchy.
Note: Only the values in a
cross table column can be sorted globally.
Click the header of the cross
table column whose values you want to sort.
In the opened pop-up menu,
beneath Sorting, click  to sort from lower to higher values, or click
  to sort from higher to lower values.
Response: The values are sorted, ignoring
any hierarchy. Hence the hierarchical structure can no longer be displayed.
An arrow in the header indicates the sort order.
Comment: You can click None
to return to the default order. Moreover, you can press Shift + click
the header to switch the sort order.
To mark the values in an entire category column:
When you want to further explore the data in the cross
table, it is possible to mark all cell values instantly in a cross table
column or row.
Click the header whose values
you want to mark.
Comment: You can click a header on the horizontal
axis, or a header on the vertical axis.
In the opened pop-up menu,
select Mark values.
Comment: Clicking a header on the lowest level
in a hierarchy will mark all cell values in the column or row. Clicking
a header on a higher level in the hierarchy will mark all values subordinate
to the header.
Comment: Instead of opening the pop-up menu, you
can press Alt + click the header to mark the values.