
Sometimes, you might want to show other values than the ones that actually define an axis as the display values. For example, you might have data for customer IDs in an external data table (e.g., streaming data), together with lots of other information, but the mapping of the IDs to actual customer names is included in a smaller, imported data table. When one of the data tables is in-database it is not possible to add columns directly to join the two tables. Then, you can choose to show the data based on the external IDs in a visualization, but to change the display values to show the customer names from the imported data table as the axis labels instead. (Data and display values alike can come from either in-memory or in-db data tables when using display values.)
Display values are configured in the expanded Data in analysis flyout. Only string columns or expressions are allowed as display values.
When defining display values and there is a single matching string column available in the target data table, you can choose to show just the value from the other column, or a combination of the old value and the display value from the other column:
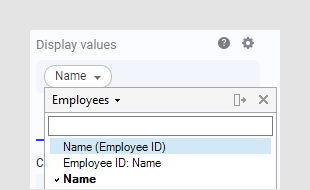
It is possible to specify similar configurations even if the shortcut options are unavailable. Do it by defining a custom expression on the display value column (such as, Concatenate([Employees].[Employee ID],": ",[Employees].[Name])). Note that expressions that mix columns from multiple data tables are not supported.
Note: Currently, only columns classified as identifiers or categories can have display values. If you select display values for another type of column then it will automatically be re-categorized as 'Categories'. This makes sure that expressions using this column expect a categorical expression instead of a continuous one. You cannot use display values with cube data and it is not possible to use images or geometry data as display values.
To use column values from a different data table, there must be a column match between the two data tables. This is often created automatically (e.g., if the name and data type of two ID columns in the data tables are the same) but you can also configure your own column matches. See Multiple Data Tables in One Visualization for general information about matching data tables.
Note: When changing the display values for a column, the display values will be shown on all places where they make sense to show up, for example, as axis labels on categorical axes, in tooltips in visualizations, or in check box-, radio button-, item- or list box filters. Range filters and other continuous applications will always show the original values. Searching in text filters is always performed against the original data, so search for a display value will not result in any hits, whereas searching in list box filters will show hits for both display values and original values. Certain functionality (Format values and Add hierarchy) is not available for filters displayed in the text area when display values are used.
To change the display values:
On the authoring bar, click
Data in analysis  ,
and click on the column you want to change the display values for.
,
and click on the column you want to change the display values for.
In the expanded flyout, make sure that Details on selected column is selected.
In the lower part of the expanded flyout, click the column selector under Display values.
Comment: If there is more than one data table in the analysis, you will see a drop-down list at the top of the expanded column selector that lets you choose a data table. If you have a single data table in the analysis you can only choose columns from that data table. See Choosing the Data to Analyze and Choosing How to Load the Data for help on how to add another data table to the analysis.
In the upper part of the column selector, choose the data table from which to pick the values for the display values.
Comment: If you cannot see any columns in the list, you might not have a column match defined. Click Edit Column Matches and add a match between the columns from the two data tables. See Column Matching for more information.
Click on the column to provide the display values.
Comment: You can also define a custom expression for the display values. For example, Concatenate([Employees].[First name], " ",[Employees].[Last name]). See below for more details.
Response: Visualizations and applicable filters are updated to show the display values instead of the original values.
Tip: To exclude an axis in a single visualization from using the display values and instead use the original values in the column, you can specify a custom expression on that axis. For example: Integer([Employee ID]) as [Employee ID]
Example
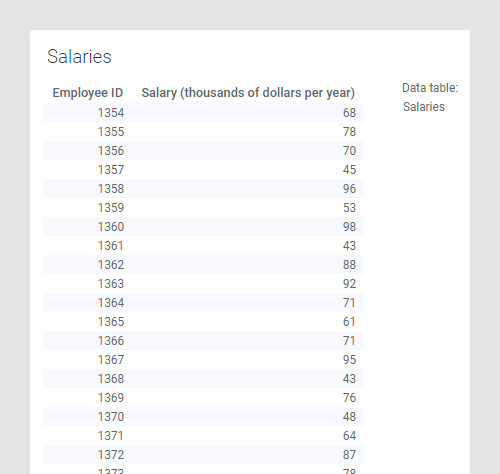
In this example, you have two different data tables in the analysis; the first one contains the salaries for a number of employees, identified using the employee number:
The second data table contains a mapping of the employee number to the first name and last name of the employees:

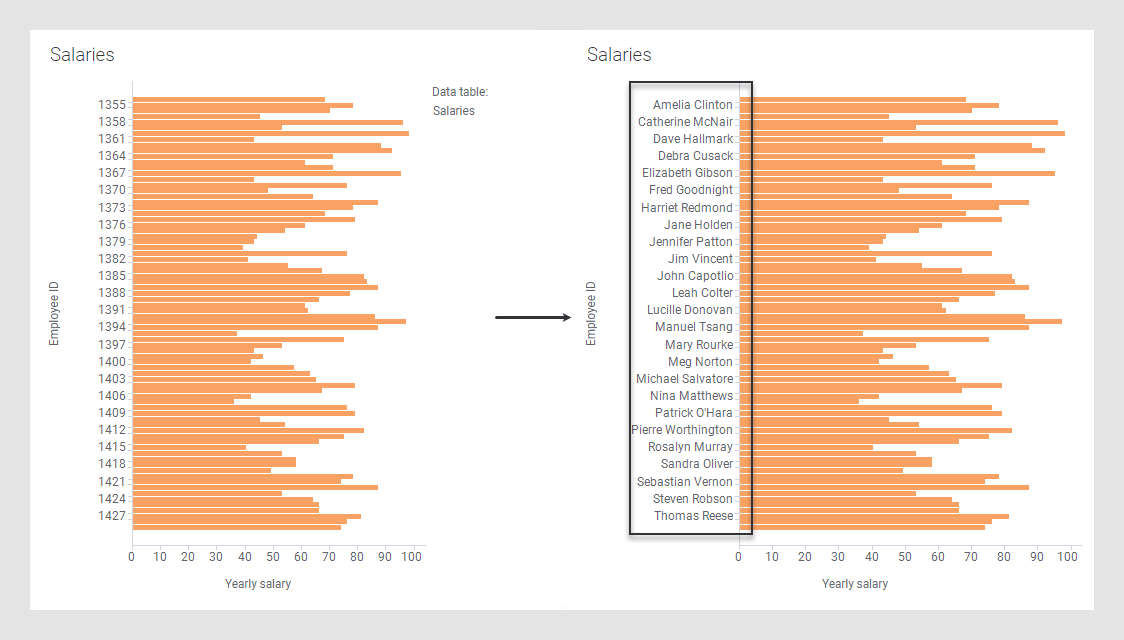
When showing the raw data from the salaries data table in a bar chart you would just see a bunch of bars with numbers on them, but by setting the display value for the employee number column to be the concatenated first name and last name of the mapping table (using the custom expression Concatenate([Employees].[First name]," ",[Employees].[Last name])) you will see which employee has which salary directly:
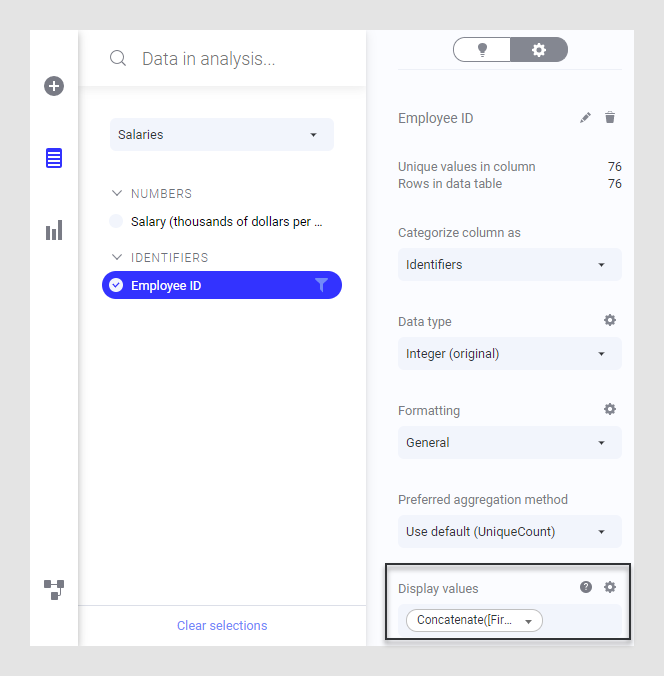
The display name for the Employee ID column in the Salaries data table has been specified in the expanded Data in analysis flyout:
Sorting columns with display values
If you define display values, data in visualizations that use them will, by default, be sorted by the alphabetical order of the display values. However, it is also possible to use display values but to show the data sorted by the original values. This gives you the opportunity to, for example, sort the bars in a bar chart by another column, or using a custom expression.
Note: When you sort data based on the display values, this is a purely visual change; any calculations are always based on the original values. If you add any expressions that rely on the order of the data, such as OVER expressions, the sorting will always be based on the original values (regardless of what has been selected in the Display values dialog).
To change how categorical data with display values is sorted:
On the authoring bar, click
Data in analysis ,
and click on the column you want to change the display values for.
In the expanded flyout, make sure that Details on selected column is selected.
In the lower part of the expanded
flyout, click the settings button next to Display
values  .
.
In the Display values settings dialog, select whether to Sort on display values or to Sort on original column values.