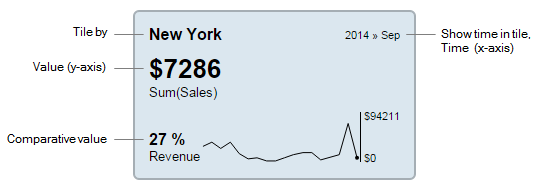
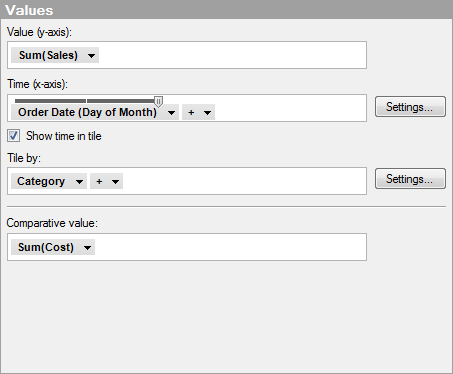
On the Values page, you specify the tile parts that are shown in the image below.
Option |
Description |
Value (y-axis) |
Specifies the column or expression to use for calculation of the KPI value to display as the primary value in a tile. The displayed value is the value that exists at the present time, meaning it shows the result of the calculation for the most recent time period on the Time (x-axis), see below. |
Time (x-axis) |
Specifies the column or hierarchy used to define on which time periods the Value calculations above should be based. For example, the Value could display a monthly or daily result. If (None) is specified, the entire time period is considered in the Value calculation. |
Settings... |
Opens the Advanced Settings dialog, where you can change the scale mode from categorical to continuous, and vice versa, as well as changing the category mode to determine which combinations to show. |
Show time in tile |
Select the check box to display, in the tile, the time period on which the Value is based. |
Tile by |
Specifies the column or hierarchy to define into which tiles the KPI should be categorized. |
Settings... |
Opens the Advanced Settings dialog, where you can change the scale mode from categorical to continuous, and vice versa, as well as changing the category mode to determine which combinations to show. |
Comparative value |
Specifies the column or expression to use for evaluation of the primary Value. The result of the evaluation is displayed in the lower left of the tile. |