How to Use a Data Function
You can use data functions that are created by a script
author and saved in the library in many different places, depending on
what the data function does. Spotfire provides the possibility for script
authors to add scripts based on several different statistical languages.
The type of script used determines which statistical engine is used to
perform the calculation. As an end user, you do not need to know which
language the script is written in, or which engine is used, as long as
the system is configured correctly. However, there might be some differences
in the available data types or conversion issues when sending data between
different systems that you want to be aware of.
Note: Time and Date formats
are not directly supported by Spotfire Statistics Services. When sending
this type of input to Spotfire Statistics Services you will get the data
back in a DateTime (TimeDate) format, where a default date or time part
has been appended to the original data. When a Currency data type is sent
to a TIBCO Enterprise Runtime for R engine, the data type is converted
from Currency to numeric, and when it is returned to Spotfire, it is converted
to real. This conversion process can result in a loss of precision for
very large values.
To run a data
function from the f(x) flyout or the Files and data flyout:
On the authoring bar, click
f(x) - analytic tools  or Files and data
  .
.
Comment: If you cannot see any data functions in
the f(x) flyout, you can select and pin data functions from the library
yourself, provided that you have the required licenses. See Pinning
Data Functions to the f(x) Flyout.
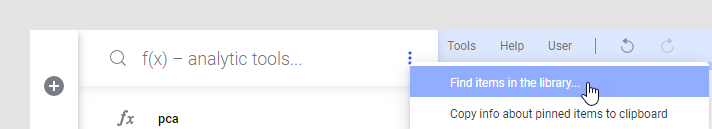
Use search to find a specific
data function. Note that search in the f(x) flyout will only search
among the pinned data functions in that flyout; you must either start
in the Files and data flyout or use the menu in the search field and
select Find items in the library to actually
search the library.
Tip: When clicking Files and data , you can
find all data functions in the library by entering type:datafunction
in the search field, and limit further by typing a part of the name.
See Searching the Library
for more details.
Click on the data function
in the f(x) flyout, or double-click on
the data function in the Files and data
flyout, to run it directly.
Note: Some data functions
require that you already have some data in the analysis to be able
to run. Others might work best if you have a specific type of visualization
available, etc.
You can view more information about the data function
before you run it by clicking on the menu next to it in the list and
selecting View details.
If the data function needs
some configuration, the flyout will show a list of the information
you should provide. Click on each item to expand and make the selections
needed.
Tip: If there are many
inputs in your selected data function, and only some of them are required,
you can click Always show required inputs first
to move optional inputs to the end of the list and hide them.
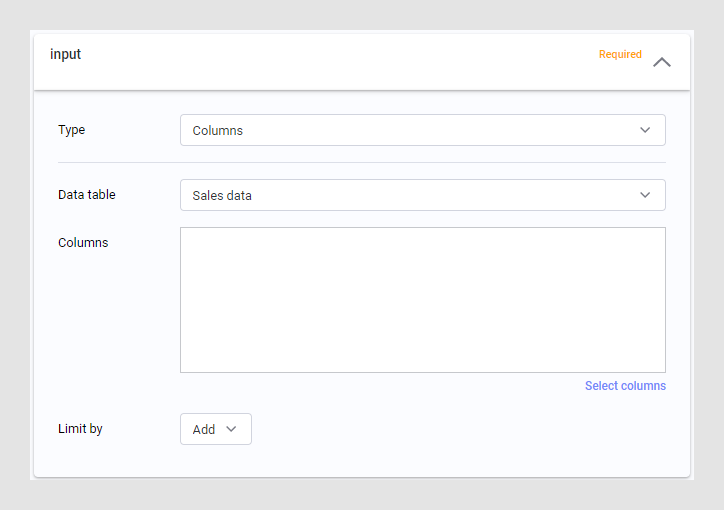
It is the author of the data function that determines
what the data function will do and what it needs to perform its function.
In some cases, you might need to select a data table, in others, you
would type a value or select one or more
columns. If you need more help understanding the different
input or output types, see Configuring
data function parameters.
Determine whether updates
to the data function results should be manual or automatic whenever
input settings are changed, using the Refresh
function automatically check box.
Click OK
when you are done.
If the results from the data
function can be added to the analysis in several different ways, the
summary view is shown in the flyout and you will get the option to
determine how
to add your new data.
Comment: Depending on the type of data function,
and how the author has configured it, you might be able to add the
data as a new data table, as rows or columns added to an existing
data table, as calculated columns, or, for single values, as a document-,
column- or data table property value. If there are multiple outputs,
you can exclude some, but not all, of them.
Click OK
when you are done.
To use a
data function as a transformation:
When you add imported data
to the analysis, you can apply a transformation to your data. Transformations
can be added either when loading the data for the first time or afterwards.
See Transforming Data
for more information. Data functions saved to the library can be used
as transformations if they use a single data table as input and produce
a single data table as output.
In the Transform data dialog,
select Data function from the drop-down
list and click Insert.
In the Data Functions – Transformation
dialog, select the data function to use and click OK.
To refresh a data function
instance in an analysis manually:
If you have added a data function to your analysis and
the underlying data has been changed, you can update the calculation using
the same settings as last time.
On the authoring
bar, click Data canvas  .
.
Locate the data function that
you want to refresh. Use the search field in the top-left selector
if you have many data tables or data functions in the analysis.
Comment: You can also refresh the data function
instance using the Data
Function Properties dialog.
Click Refresh.
To
edit mapped data function inputs:
On the authoring
bar, click Data canvas .
Locate the data function that
you want to edit. Use the search field in the top-left selector if
you have many data tables or data functions in the analysis.
Click the round settings button
(Edit data function inputs) to the left
of the fx node.
Make your changes in the Configure
data function flyout and click OK.
Tip: You can sometimes also
tweak inputs from visualizations where the data function outputs are used.
See Interactive
Tuning of Data Functions.
To
edit a mapped data function output:
If you have added an output result to the wrong data table,
or to the wrong document property, you can reconfigure the output from
the data function view in the data canvas.
Note: Remember that changing
outputs that are used in data tables can severely affect the final content
of the data tables, because all structural changes will be applied to
the end of the data table source tree.
On the authoring
bar, click Data canvas .
Locate the data function that
you want to edit. Use the search field in the top-left selector if
you have many data tables or data functions in the analysis.
Click the round settings button
(Configure the output) to the right of
the output parameter that you want to reconfigure.
Response: The Configure data function output flyout
is displayed.
Specify what to do with the
output parameter, and then click OK.
Comment: For a description of the available input
and output types, see Configuring
Data Function Parameters.
Response: The function is executed. Depending on
how the output parameters were set up, you may get a new or updated
data table, new columns or rows, or an updated data table, column,
or document property, which can be used to control a variety of settings
in your analysis.
To
automatically run the data function when an analysis is opened or inputs
are changed:
When you add a data function in Spotfire, you can specify
whether that data function should refresh automatically and run every
time the Spotfire analysis is opened. You might want to avoid this option
if the data input does not change, and running the data function consumes
a lot of time and resources.
However, if the input data changes frequently and you want
the data function to reflect the changes in a visualization, automatic
refresh can be helpful.
Go to one of the places where
you can add or edit a data function:
On the authoring bar,
click Files and data  , or f(x)
and then use search or browse to find and open the data function
of interest.
, or f(x)
and then use search or browse to find and open the data function
of interest.
In the data canvas, locate
the data function instance and click Edit
data function inputs.
In the Edit
Parameters dialog (on the menu bar, select Data
> Data function properties, click
Insert, or select an already added data function and click
Edit Parameters).
Make sure that the option
Refresh function automatically is selected.
Note: If your analysis
contains a cyclic dependency, the data function switches to manual
update automatically so it does not get stuck in an update loop.
Configure all data tables
in the analysis that are outputs from the data function to be Linked (individual settings per source) (not
Embedded in analysis). You can set this configuration option from
Data > Data table properties.
To sync a data
function instance with the definition in the library:
If a newer version of the data function definition that
was used in the document is available in the library, you can click sync
to update the data function in the analysis with the changes made in the
library.
On the menu bar, select Data > Data function properties.
In the Data
functions in current analysis list, click to select the data
function instance of interest.
Click Sync
from Library.
Click Close.
To remove a previously
inserted data function instance from the analysis:
On the authoring
bar, click Data canvas .
Locate the data function instance
that you want to remove. Use the search field in the top-left selector
if you have many data tables or data functions in the analysis.
Click Delete.
Response: The data function instance is removed
from the current document but any outputs that were added (columns,
data tables, document properties, etc.) will remain until you remove
those manually.
Comment: You can also remove the data function
instance using the Data
Function Properties dialog.
To pin or unpin data function definitions to the
f(x) flyout:
See Pinning
Data Functions to the f(x) Flyout.
To
delete a saved data function definition from the library:
If you are a data function author who create data function
definitions for others, you might want to remove old data function definitions
from the library, as you create newer or better ones.
On the authoring bar, click
Files and data .
Locate the data function of
interest.
Comment: You can use the search field at the top
of the flyout to locate the data function. (Use 'type:datafunction'
as the search expression in the search field to find all data functions,
and limit further using text in the name.) See Searching
the Library for more information about search expressions.
Click on the menu next to
the data function in the list and select Delete.
Response: A dialog asking you if you are sure you
want to delete the data function is displayed. Click Yes
and the data function is removed.
Tip: If you have administrative
rights you can also delete a data function using the Library
Administration tool.
To edit the name, description or keywords of a saved
data function in the library:
On the authoring bar, click
Files and data .
Locate the data function of
interest.
Comment: You can use the search field at the top
of the flyout to locate the data function. (Use 'type:datafunction'
as the search expression in the search field to find all data functions,
and limit further using text in the name.) See Searching
the Library for more information about search expressions.
Click on the menu next to
the data function in the list and select Edit
properties.
Response: The Edit Properties dialog for the selected
data function is displayed.
Change the properties for
the data function and click OK.
Tip: If you have administrative
rights you can also edit the name, description and keywords of a data
function using the Library
Administration tool.
To recreate a deleted result output:
If you run a data function that creates one or more columns,
and then you delete one of the result columns from the analysis, the lost
column remains deleted if you refresh the data function.
To recreate the lost output, edit the data function output
mapping from the data canvas. This will rerun the data function and add
the output result as specified.
To
allow end users to refresh a data function from a text area:
When a data function has been executed once, so an instance
is available in the document, an author can configure the analysis so
that it is possible to refresh the output by clicking an action link or
button in a text area. This can make it possible for other users
of the analysis to find and update the data function, even if they are
not data function authors. For example, if the data function has been
configured to work with filtered rows, many people can access the analysis,
filter to their special area of interest and click on a button to receive
calculation results relevant for them.
Create an analysis and run
the data function from the Files and data
flyout, the f(x) flyout, or from the Data Function Properties dialog. It is also
possible to run the data function directly from the Register
Data Functions dialog, if you are a data function author. Make
sure that Refresh function automatically
is cleared.
Comment: You must run the data function initially
to make the current document aware of the data function, but remember
that each time you run the data function you create a new instance
in the document.
Create
a text area, and then enter edit mode by clicking Edit
Text Area,  .
.
Click Insert
Action Control,  .
.
Response: The Action
Control dialog is displayed.
In the left pane, click Data Function.
Type the Display
text to use on the button or link.
Select the Control
type to use.
Click to select the data function
of interest from the Available data functions
list.
Comment: Only those data functions that have been
executed from within the current document and do not use automatic
refresh are available.
Click OK
and save the text area.
Response: The button or link (or image) is added
to the text area.
To use the result from a data function to draw a
line in a visualization:
Data functions can be used to calculate new data that can
be used to do such things as drawing a line in a visualization. This can
be accomplished in a variety of ways, but the steps below describe an
example where the data function result is presented as two new columns
containing coordinate values. It is the author of the data function that
determines how it will work.
Execute a data function that
uses current data columns as input and performs a calculation before
the new resulting columns are added to the data table as calculated
columns.
Response: The data function is added to the document,
and the result columns are added to the data table.
Create a visualization that
can display lines and curves, such as a scatter plot.
Comment: Line from Column Values cannot draw curves
over categorical axes, so make sure that the value columns on both
axes are continuous.
Right-click in the visualization
and select Properties.
Comment: You can also select Visualizations
> Visualization properties on the menu bar.
Response: The Visualization Properties dialog is
displayed.
Click Lines
& Curves.
Click Add
and select Line from Column Values.
Comment: Use this option if the data results are
located in one X-values and one Y-values column. If the results from
the data function are presented as curve parameters, you should use
Curve
from Data Table instead. If a curve equation is calculated, use
Curve Draw.
Response: The Line
from Column Values dialog is displayed.
Select the Data
table with line values.
Comment: This should be the data table where the
result columns were added.
Select the X-values
column.
Select the Y-values
column.
If desired, select a Sorted by column, to specify a different sort
order.
Specify whether to Ignore
(skip) empty values or to Split curve
at empty values.
Specify whether to use an
Automatic or a Custom
curve name.
Click OK.
Response: The curve is added to the visualization.
To change
the address to Spotfire Statistics Services:
The address to
Spotfire Statistics Services is normally specified by the TIBCO Spotfire
administrator, on a group level. This step instruction shows how an administrator
can change the address for a user group. It is also possible to use a
local calculation engine (see below).
Login
to TIBCO Spotfire as a user with administration rights.
On
the menu bar, select Tools > Administration
manager.
Response: The Administration Manager is displayed.
Click
on the Preferences tab.
Click
on the group of interest in the Selected group
list.
Response: The preferences and configuration sets
for the selected group are displayed.
On
the Preferences tab, click the plus sign next to TIBCO
Spotfire Statistics Services to expand that group.
Click
on StatisticsServices in the TIBCO Spotfire
Statistics Services group.
Response: The currently specified TIBCO Enterprise
Runtime for R URL, S-PLUS URL, R URL, SAS®
Software URL and MATLAB®
URL are shown.
Click
Edit.
Response: The Edit Preferences dialog is displayed.
Type
or paste a new URL for Spotfire Statistics Services, for the implementation
of your choice.
Click
OK.
Click
Close.