|
Option |
Description |
|
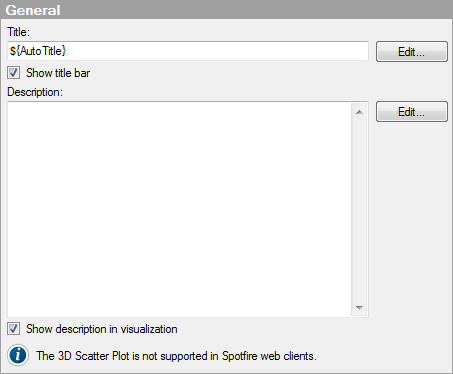
Title |
The title of the visualization. Tip: Double-click the title bar of the visualization, and type a new title. |
|
Edit... |
Opens the Edit Title dialog where you can add properties to the title so that it changes with a selection. For example, you may want the visualization title to change depending on the columns or expressions you specify on the axes. See Titles and Descriptions Overview for some examples. |
|
Show title bar |
Specifies whether or not to show the visualization title. |
|
Description |
A description of the visualization. This description can optionally be shown in the legend and/or in the visualization. |
|
Edit... |
Opens the Edit Description dialog where you can add properties to the description so that it changes with a selection. For example, you may want the description to change depending on the columns or expressions you select on the axes. See Titles and Descriptions Overview for some examples. |
|
Show description in visualization |
Specifies whether or not to show the description in the visualization. |
Note: You can open an analysis containing a 3D scatter plot in the web client, but you will be informed that the visualization cannot be shown in the web client.