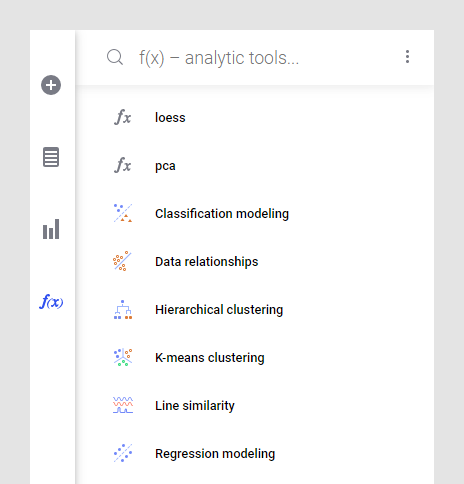
The f(x) flyout is a handy way for Spotfire Analyst or Desktop authors to easily reach their analytic tools. By default, the flyout will contain the Spotfire tools for Data relationships, K-means clustering, Line similarity, Hierarchical clustering, Regression modeling and Classification modeling, but the biggest advantage and flexibility with the flyout lies in the possibility to pin your own data functions to the flyout.
By pinning your most used data function definitions to the flyout you will always be able to easily apply the data function to new analyses.
An administrator can also pin data functions to the flyout using a preference setting. See Pinning Data Functions to the f(x) Flyout for more information.
For information about already used data function instances in the analysis, see Data Function Properties and How to Edit Data Function Properties.
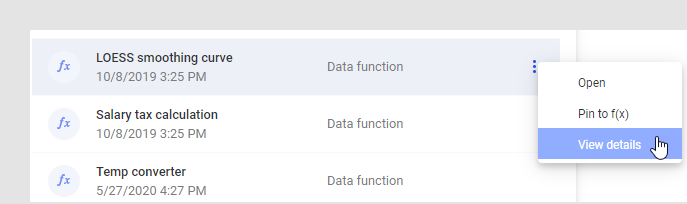
When hovering with the mouse pointer over a data function in the f(x) flyout, or when browsing the library using the Files and data flyout, you will see a menu next to the data function where you can select View details to see more information.
Click on the data function in the f(x) flyout to run it (when applicable; for example, some data functions cannot run unless you have data in the analysis).
Tip: When a data function instance has been added to an analysis once, and the outputs are columns or rows used in a visualization, you can tweak your input values directly from the visualization context, and try out the effect of different input values.