Details on Filter Rows
This dialog is used to transform a data table by excluding
rows based on a boolean expression. Only those rows matching the expression
(the rows for which the expression is True) will be included in the data
table. This approach gives a more permanent way to remove rows as compared
to deleting marked rows directly in the analysis, because the transformation
is reapplied when data is reloaded. By adding a filter rows transformation,
you can make sure that values you never want to include in your data table
gets filtered out even before loading the data.
Tip: You can easily add a transformation
based on the current filtering in one or more selected filters by right-clicking
in the Filters panel or the Data in analysis flyout.
To add a Filter Rows transformation when adding
a data table:
On the authoring bar, click
Files and data  .
.
In the Files and data flyout,
locate the data of interest by searching for a suitable keyword or
by browsing the different categories.
Tip: You can also apply
transformations when you replace
a data table and when you add
columns or rows to
an already existing data table.
In the Add
data to analysis summary, click on the new data to expand the
settings section, and click Transform data.
In the Transform data dialog,
select Filter rows from the drop-down
list and click Insert.
Click OK
to close all dialogs and to add the data.
To add a Filter Rows transformation to data that
is already loaded into Spotfire:
Select Data
> Transform data....
In the Data
table drop-down list, select the data table you want to add
the transformation to.
Select Filter
rows from the drop-down list and click Add....
To add a Filter Rows transformation based on current
filter settings:
In the Filters
panel, or in the Data in analysis flyout,
filter your data to include only what you want to keep in the analysis.
When you are done, right-click
the filter and select Create Filter Transformation
from the pop-up menu.
Comment: In the Filters panel, you can press Ctrl
and select more than one filter before right-clicking, if you want
to base the transformation on more than one filter.
Response: A transformation is added to the data
table where the filtered out data is excluded. For example, if clearing
the check box for the two regions "Northeast" and "Midwest"
in a check box filter, then the expression in the added transformation
will be ([Region] NOT IN ("Northeast",
"Midwest")) OR ([Region] IS NULL).
To add transformations to a specific node in the
source view:
In the Data
canvas, click on the node where you want to add a transformation.
Response: Details about the selected node are shown
in the lower left part of the source view.
In the list of steps for the
selected node, click on the plus sign where you want to add a new
transformation (or transformation group).
In the Transform data dialog,
select Filter rows from the drop-down
list and click Insert.
Click OK.
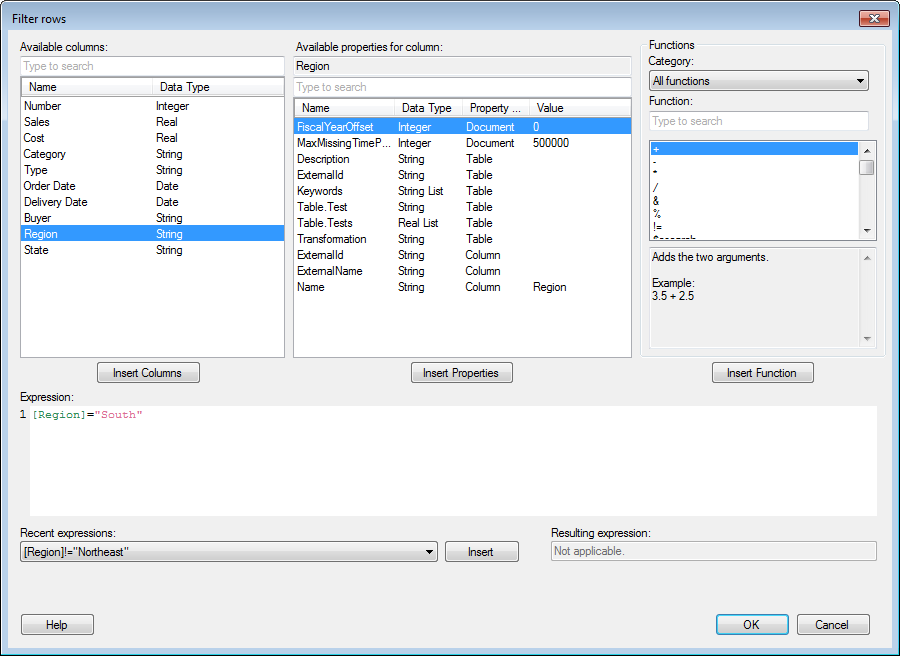
Option |
Description |
Available columns
|
Shows all
available columns. Select a column by clicking on it in the list
and then click on the Insert Columns button, or double-click on
the column to send it to the Expression field. You can narrow
down the list of available columns by typing a part of a name
in the "Type to search" field. You can also enter an
expression in the field, using the rules described on the
Searching in TIBCO Spotfire page. Press Ctrl or Shift to select
multiple columns. |
Insert
Columns
|
Inserts
the selected columns in the Expression field. |
Available
properties for column
|
Shows all
properties that you can use in the calculation of a new column.
The column properties are specific to the column selected in the
Available columns list to the left.
Select a property by clicking on it in the
list and then click on the Insert Properties button, or double-click
on the property to send it to the Expression field. The property
will automatically be inserted as a value in this context.
See Properties
in Expressions for more information.
You can narrow down the list of available
properties by using the search field. |
Insert
Properties
|
Inserts
the properties selected in the Available properties for column
list at the current cursor position in the Expression field. |
Category
|
Select
a category of functions to limit the choices in the Function list:
All
functions
Binning
functions
Conversion
functions
Date
and Time functions
Logical
functions
Math
functions
Operators
Property
functions
Ranking
functions
Spatial
functions
Statistical
functions
Text
functions |
Function
|
Select
a function by clicking on it in the list and then click on the
Insert Function button, or double-click on the function to send
it to the Expression field. You can narrow down the list by typing
a part of a name in the field where it says "Type to search". |
Description
|
Shows a
brief description of the selected function. For more detailed
descriptions, see the Functions
chapter. |
Insert
Function
|
Inserts
the selected function in the Expression field. |
Expression
|
This is
the text field in which you build your expression. You can insert
columns and functions from the lists or enter text as in any standard
text editor.
See Expression
and Script Editor Keyboard Shortcuts for information about
available shortcuts. |
Recent
expressions
|
Displays
the ten expressions you have most recently created. You can select
one of these and click the Insert button to insert the expression
into the Expression field. |
Insert
|
Inserts
the selected Recent expression into the Expression field. This
will replace the entire content of the Expression field. |
Resulting
expression
|
[Not applicable.] |
Tip: This transformation is
similar to the Limit data using expression
option found on the Data page in the Visualization Properties for many
visualization types. If the expression used should affect all visualizations
in the analysis it is more efficient to add the limitation as a Filter
rows transformation. If you only want to exclude data from a certain visualization,
then you should probably limit using Visualization Properties instead.