Option |
Description |
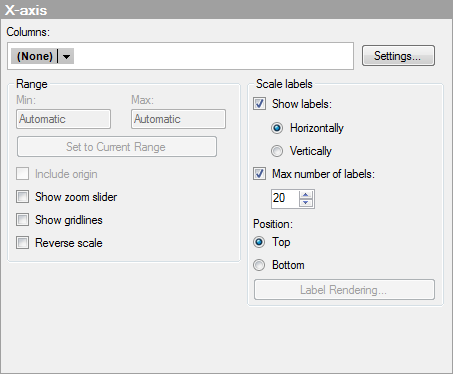
Columns |
Specifies the column or hierarchy to be displayed on the X-axis. |
Settings |
Opens the Advanced Settings dialog where you can specify how to display the categories on the axis. |
Range |
|
Min |
Not applicable to heat map visualizations. Available for continuous axes only. |
Max |
Not applicable to heat map visualizations. Available for continuous axes only. |
Set to current range |
Not applicable to heat map visualizations. Available for continuous axes only. |
Include origin |
Not applicable to heat map visualizations. Available for continuous axes only. |
Show zoom slider |
Shows a zoom slider which you can manually manipulate to view only those cells in the heat map you are interested in. |
Show gridlines |
Specifies whether or not vertical gridlines should be visible. |
Reverse scale |
Reverses the current sort order so that the lowest value is displayed on the right-hand side of the scale. |
Scale labels |
|
Show labels |
Specifies whether or not scale labels should be visible. |
Horizontally |
Shows scale labels horizontally. |
Vertically |
Shows scale labels vertically. |
Max number of labels |
Select the check box to specify a maximum number of scale labels to be shown. Limiting the number of labels can improve readability on axis scales with many values. |
Position |
|
Top |
Select this option to place the X-axis scale labels on top of the heat map. |
Bottom |
Select this option to place the X-axis scale labels at the bottom of the heat map. |
Label Rendering... |
[Only available when the selected column only can be categorical. For example, if the selected column is a string column or a binary column.] Opens the Label Rendering dialog where you can change the rendering method of the axis labels from text to images in applicable cases. |