This dialog contains information that may be useful in contact with Spotfire customer support, as well as possibilities for specifying client side logging and error reporting. See the section for each tab below for details.
To reach the Support Diagnostics and Logging dialog:
On the menu bar, select Help > Support diagnostics and logging.
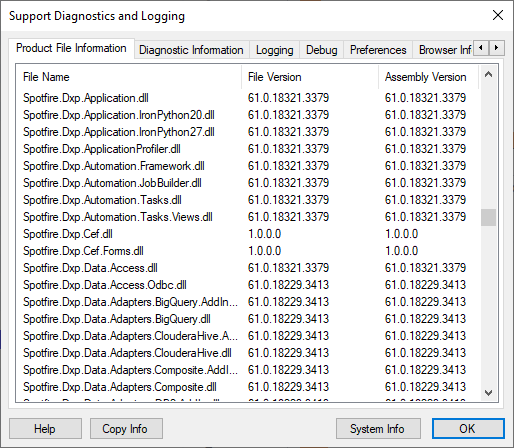
Product File Information Tab
Option |
Description |
Product
File Information |
Displays detailed information about the versions of various files and assemblies. |
Copy Info |
Copies all information available in the Support Diagnostics dialog to the clipboard. This is often requested if you are in contact with Spotfire Support. |
System
Info |
Opens the Microsoft System Information dialog, displaying additional information. |
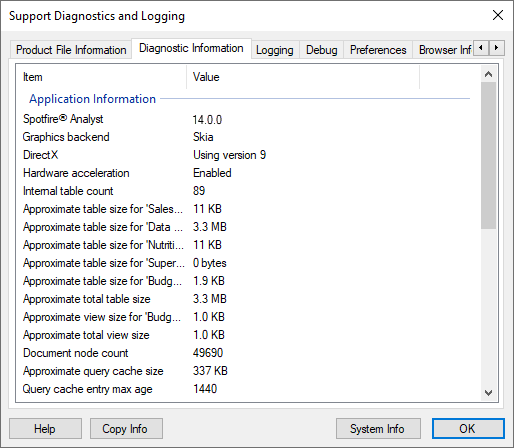
Diagnostic Information Tab
Option |
Description |
Application
Information |
Lists the version of Spotfire and DirectX installed on your computer as well as information about whether or not hardware acceleration is enabled. |
System
Information |
Lists the name and version of your operative system, as well as the .NET version on your computer. |
Spotfire
Server Information |
Lists the name of the Spotfire Server and the deployment area on the server you are connected to. This section also includes information about the operating system on the server and other information about the server that may be of interest to support. |
Copy Info |
Copies all information available in the Support Diagnostics dialog to the clipboard. This is often requested if you are in contact with Spotfire Support. |
System Info |
Opens the Microsoft System Information dialog, displaying additional information. |
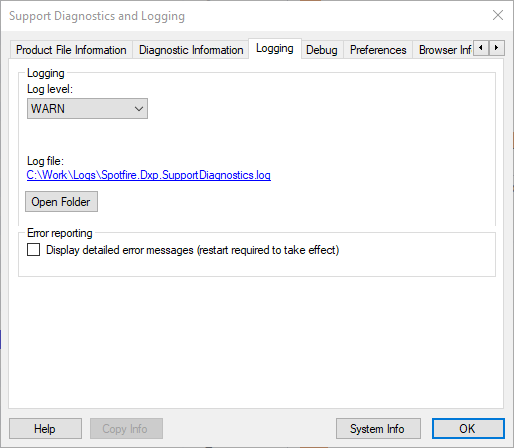
Logging
The logging tab settings are not available if you have created a custom log4net.config file in the Spotfire AppData directory.
If the log level is INFO or higher, a file called PerformanceCounterLog.txt containing a set of useful performance counters will be available in the log file folder. At DEBUG level, the set of counters will be bigger.
Option |
Description |
Log
level |
Allows you to specify the log level. An increased log level might be useful when communicating with Spotfire Support, while trying to troubleshoot Spotfire Analyst. |
TRACE |
Used to log very detailed information and events when debugging the application. This is the log level that collects the most information and it is primarily used when Spotfire support asks for more information. Note: When the log level is set to TRACE, query logging for data connectors is enabled. When you work with data connectors, information about all queries that are generated and sent to external data sources is logged to the separate log file Spotfire.Dxp.QueryLog.log. |
DEBUG |
Used to log detailed information and events when debugging the application. Note: When the log level is set to DEBUG, query logging for data connectors is enabled. When you work with data connectors, information about all queries that are generated and sent to external data sources is logged to the separate log file Spotfire.Dxp.QueryLog.log. |
INFO |
Used to log information regarding the progress of the application, including all potentially harmful situations and errors. |
WARN |
Used to discover all kinds of potentially harmful situations. This is the default log level. |
ERROR |
Used when tracking fatal and non-fatal error events. |
FATAL |
Used when tracking severe error events only. |
Log
file |
Shows the path to the log file. Click on the link to open the log file directly. |
Open
Folder |
Opens Windows Explorer to the folder containing the log file. |
Display
detailed error messages (restart required to take effect) |
Allows detailed error messages to be displayed. For the setting to take effect you need to restart Spotfire. |
System
Info |
Opens the Microsoft System Information dialog, displaying additional information. |
Debug
The debug tab allows you to help Spotfire support investigating issues with your analysis file. For example, you can create a dump file which can be sent to support and be of use when investigating problems. The chances of getting your problems fixed greatly increases if you can attach a dump file to your support issue.
The performance logger and memory diagnostics are mainly used to provide additional information when requested by Spotfire support.
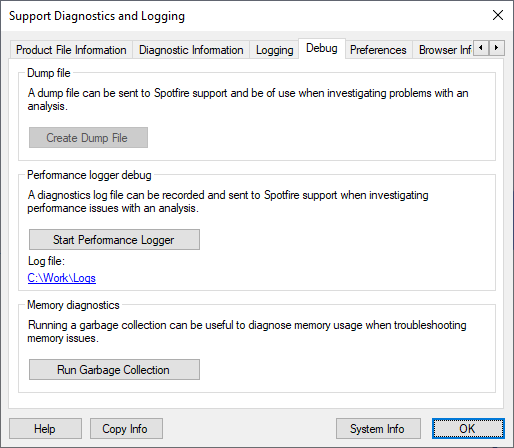
Click on the Create Dump File button to create a Spotfire dump file. You will be prompted to specify the name and location of the file. The newly created dump file is a .zip archive, so if you want to view the underlying files you will need to extract its contents using a program like WinZip or 7Zip.
The dump file contains all information about your analysis, including the current data and all analysis steps performed so far.
You can also create a performance logger log file, if this is requested by support. This option is only available when an analysis is open, since it is used to record what happens when actions are performed within a specific analysis. Click Start Performance Logger, return to the analysis and perform the actions that cause problems and then go back to this dialog to click Stop Performance Logger. Locate the created log file and include it in your conversations with Spotfire support.
Finally, running a garbage collection may be of use when troubleshooting memory-related issues with the analysis.
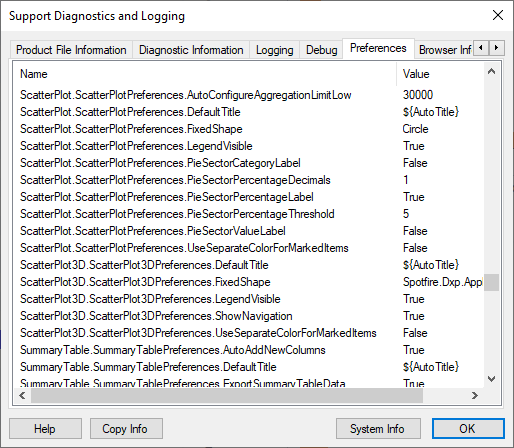
Preferences
Displays the currently used preference settings. Since your own default settings made under Tools > Options will take precedence over any settings made by the administrators, it may be important to compare the currently used preference settings when troubleshooting specific analyses.