You can add relations to carry over markings and, optionally, also filtering between data tables in the analysis. A relation is created by defining how values should be matched using one or more identifier column.
In the dialog, select the two data tables you want to connect from the drop-down lists.
For each data table, select the column or expression to use when matching the data tables.
You might need to modify one or more of the columns you use to get a good match between the values in the different data tables. For example, if the identifiers are written in uppercase letters in one of the data tables and in lowercase letters in the other, you can use the expression Lower([MyColumn]) instead of just [MyColumn] with the uppercase column and change the letters to lowercase. For data tables referring to cube data sources you can specify that the match should be based on keys rather than values by selecting the KeyOf method for the cube data table.
Comment: The Sample field shows the result of the selected expression after any specified functions have been applied and you can verify that values match as expected.
If needed, you can add more matches to get a working relation.
Comment: There is always only one technical relation between two data tables, but the relation can contain multiple matches. This means that the background (and API) expression describing the entire relation is on the form f=g and h=i and ..., where each column pair is separated by an "and".
When you are done, click OK.
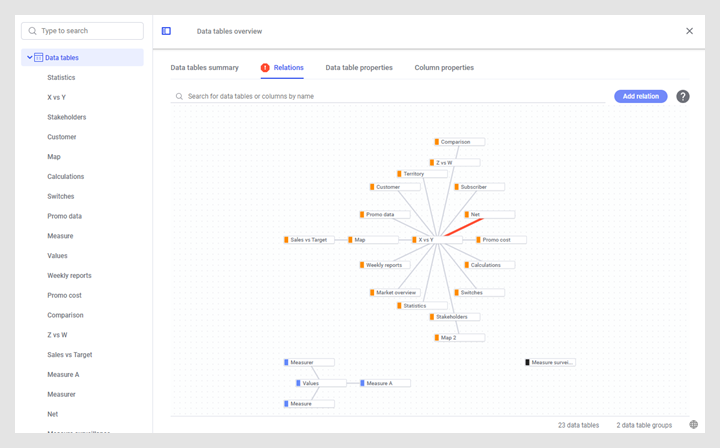
All relations can be inspected in the Data canvas. On the Relations tab in the Data tables overview, you can easily see if there is anything wrong with a relation and you will quickly find groups of data tables where relations have been specified:
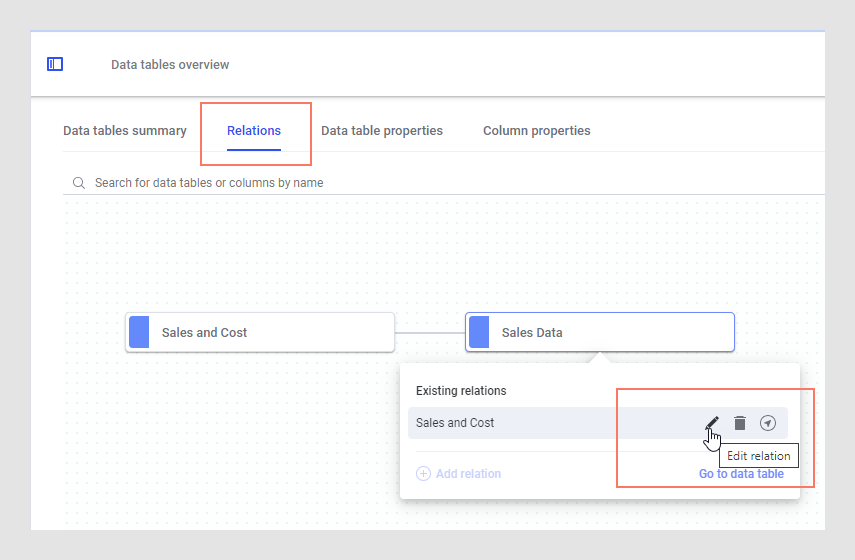
You can edit an existing relation by clicking on a node or an edge (the line between nodes), hovering with the mouse pointer on the row of interest, and then clicking Edit relation in the popover.
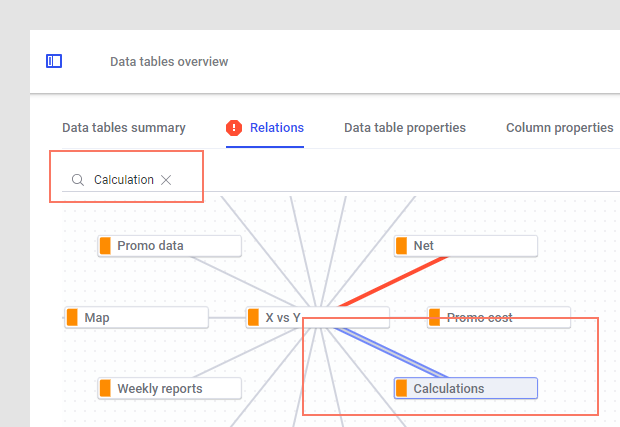
Any previously defined relations that contain errors are shown in red. You can also use the search field to search for a specific data table or column. Plain search matches the beginning of the data table or column name but you can also use wildcards (*) to match parts of the names. All matches will be shown with a blue outline in the graph:
Use the scroll wheel on the mouse to zoom in or out in the relations graph, or drag the canvas to move the graph to a new position.
Tip: You can edit the color for a data table group by clicking on the color stripe to the left of the data table name on a node.
See also: