Option |
Description |
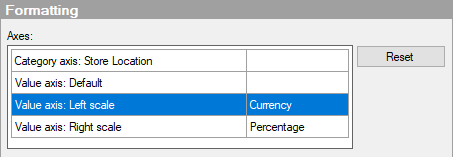
Axes |
Displays which column and category are currently being used on each of the two axes in the bar chart. Click the one you want to change the settings for. If the columns on the axes are of the same type, you can set formatting for both axes at the same time. If you use more than one scale on the value axis, each of the different scales will appear in the list, and you can apply formatting to them individually. For example, if you use dual scales, you can format the left and right scale separately as shown below.
|
Reset |
Resets the formatting for the selected axis values according to the settings defined on column level. If no column formatting has been set, axis formatting settings defined in the Options dialog will be used. If no settings have been specified in the Options dialog, the default settings for the visualization type will be used. |
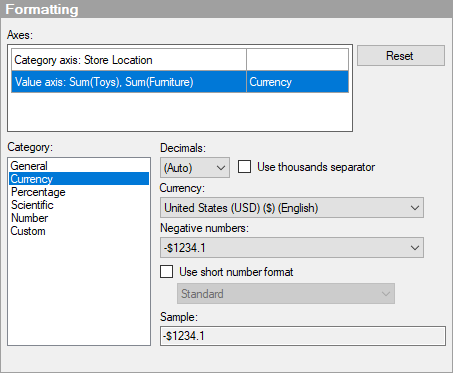
Category |
Lists the available formatting categories for the selected axis. Each category in this list has separate settings. Which categories are available depends on the data type of the selected axis. See Formatting Settings for a full description of all possible options. |
Note: These settings affect only the current visualization. For general information about formatting, see Formatting Overview.