Specifying Key Columns for a Data Table
Key columns (or a primary key) are used when you need to
uniquely identify all rows in the data table. You should specify key columns
if you want to be able to reapply markings in unaggregated visualizations
that were active when saving the file, if you want any specified tags
or bookmarks to be able to be reapplied when reopening the analysis file,
or, if you want to be able to replace specific values in a data table.
However, there is no guarantee that a selection always can be reapplied
even if key columns are specified because selection of a visualization
item might also include references to other columns than the key columns.
Note: Each row must be determined
by a unique combination of values in the specified columns.
As an example, for each row with a tag or a marking in
your current analysis, the values for the specified columns are
noted in the saved analysis file, and when the analysis file is opened
again, rows matching those criteria will be tagged or marked again.
This means that if a new row has been added to the data table that
also matches a criterion for a tag or a marking, the tag or marking
is not unique and therefore invalid. Neither the new row nor the original
row that was tagged or marked, will receive any tag or marking when reopening
the analysis. However, a 'Replace specific value'-operation will replace
the value for all matching rows, even if key columns no longer are unique.
Unless the transformation has been configured to ignore warnings, you
will be informed about the non-unique keys in the data canvas.
To specify key columns:
On the authoring bar, click
Data canvas  .
.
Make sure the data table of interest
is selected.
Comment: This step is only applicable if you have
two or more data tables in the analysis.
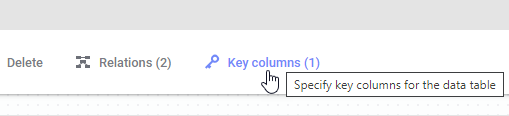
On the data canvas toolbar,
click Key columns.
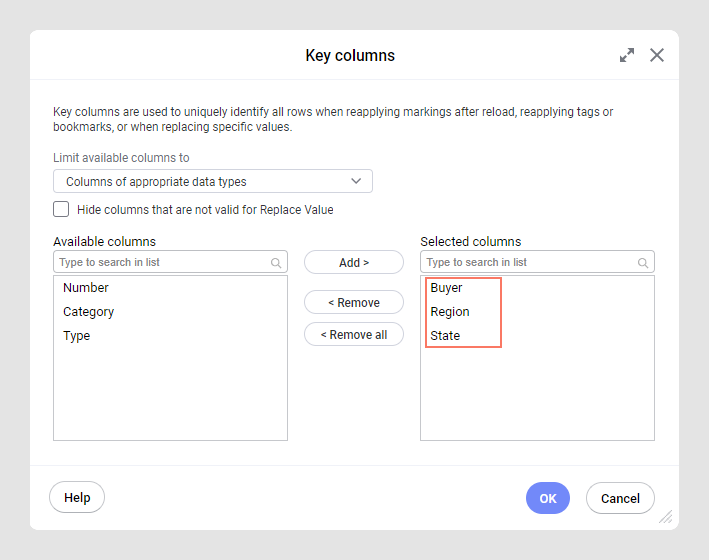
In the Key columns dialog,
select one or more columns that uniquely identify all rows in the
data table by clicking on them and then clicking Add
>.
For details about the Limit available columns to drop-down list and
the Hide columns that are not valid for Replace
Value check box, see inline help or the example below.
If you need to remove one
or more columns from the Selected columns
list, select the columns and click < Remove
or click < Remove all.
When you are done, click OK.
Example: Adding key columns for a customer data
table
In a data table where transactions from different customers
(buyers) are analyzed, the names of customers are sometimes the same,
even though they are different people. To uniquely identify each customer,
you might need to specify both the name and the address or region of the
customer as key columns.
When you open the Key columns dialog, you might only see
recommended columns in the Available columns list, but you can use the
Limit available columns to list to help you find columns to use.
There can be three different options available in this
list:
Recommended
columns
Lists columns with Integer/LongInteger or String data types that have
unique values for all rows, if available. It is likely that these
columns are good choices for determining a unique identifier for each
row, but you might have a data table where other columns are more
suitable. For example, if you have a column containing transaction
numbers, it might be suitable to identify specific transactions uniquely,
but not to find unique buyers.
Columns
of appropriate data types
This option only shows columns of data type Integer/LongInteger or
String, because these are more likely to provide unique identifiers.
Even if a column does not have unique values of all rows, a combination
of several columns (e.g., 'First name' and 'Last name', or 'Name'
and 'Address') can be sufficient to provide a unique identification.
All columns
This option shows all columns in the data table. You might have a data
table where you can uniquely identify your rows using other type of
columns (for example, a Date column).
You can also change the Hide columns
that are not suitable for Replace Value check box, to find more
or less columns.
Some columns that are valid key columns for keeping markings,
tags and bookmarks are not valid when using the 'Replace Specific Value'-transformation
directly from a table visualization. This applies to any column that has
been modified using a column conversion from the column view in the expanded
data in analysis flyout (that is, when the column modification was done
on the final data table). When this check box is selected, all columns
that would result in invalid keys for Replace Value will be hidden.
In the image below, three columns have been added to uniquely
identify each buyer in this data table.