If you have added any data functions to your analysis,
you can find all currently used data function instances in the Data
canvas ![]() .
.
Use the search field in the data canvas sidebar and click on the data function instance name, or use the arrows next to the data function name, to navigate to a specific data function instance.
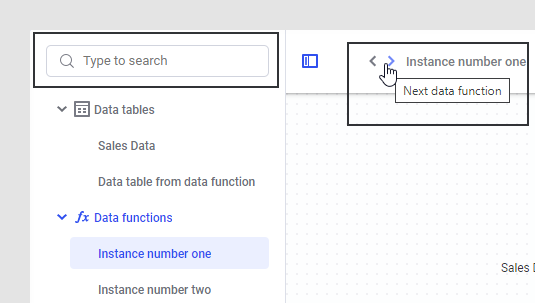
In the top toolbar, you can select to Rename, Refresh or Delete the data function instance.

Note: You might have several
instances based on the same data function definition in the analysis,
if you have added the data function multiple times. See What
are Data Functions? for more information about definitions vs. instances.
To rename a data function definition in the library, use the Rename functionality
in the Files and data flyout (the  on the authoring bar).
In the graphical structure, all inputs to the data function are listed to the left and all outputs to the right of the data function node ("fx" in this image). Note that the author of the data function can specify different icons for data functions when registering them, so you might see some other icon on your own data function node.
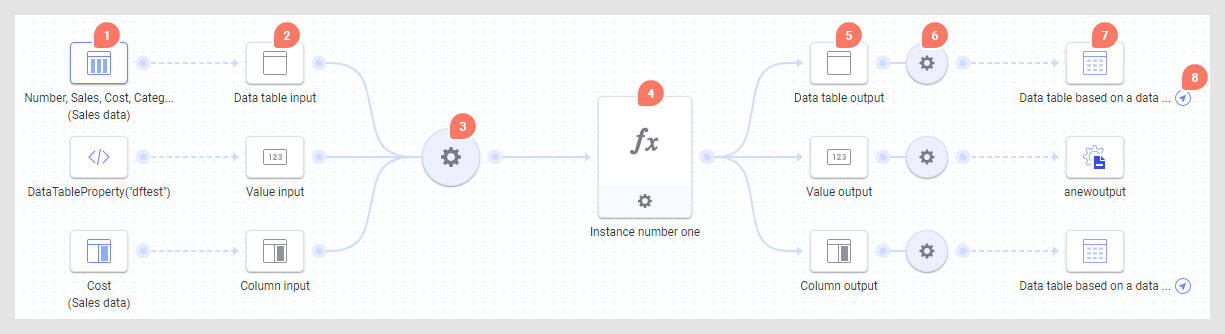
The leftmost column shows the currently mapped inputs and the icons represent the input type (data table, column, expression, property or manually added value).
The second column shows the display name of the input parameter together with the type of input as specified in the data function definition (table, column or value).
To edit inputs, click the round settings button.
The fx node represents the data function itself. Click the settings button to edit the data function script (available in the installed client only).
The display name and type of the outputs (table, column or value).
Click the round edit button to configure or reconfigure an output. Note that if you change an output used as a data source, the new output will always be applied to the end of the data source tree. It is only the modified output that is affected (if the data function contains multiple outputs).
The currently mapped outputs in the analysis (data table, columns or rows added to a data table, calculated column, or property).
The navigation arrow allows you to quickly go to the data table source view of the data table where the output is used. Similarly, you can click the navigation arrow in the data table source view to go to the data function view and view all inputs and outputs for the data function instance.
You can click on a node to see details in the fields below, just as you can for data tables in the data canvas.
The Information tab contains information about what you are looking at right now (which type of node it is) and which configurations have been made, whereas the Data tab shows the actual content of the configured input or output, when applicable.