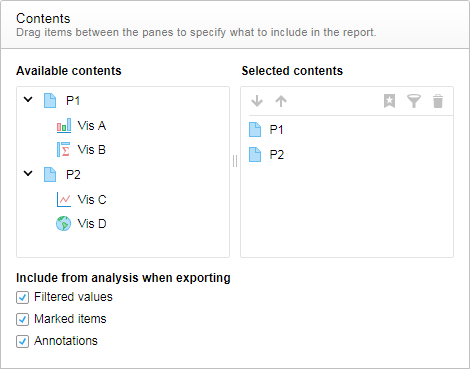
In the Contents part of the report settings, you define what in the analysis to include in the report. It is possible to mix all or selected analysis pages with individual visualizations.
The Available contents pane lists all the analysis pages and their visualizations, and the Selected contents pane shows what to be exported. You simply drag the items between the Available contents and Selected contents panes to specify the report content. If you want, you can re-order the items in the Selected contents pane afterwards by dragging them to the wanted position in the report.
Note: It is possible to include also hidden pages in a prepared report. A dimmed page icon indicates that the page has been hidden.
Moreover, you can use the check boxes Filtered values and Marked items to specify whether any filtering and marking made in the analysis should be included in the report. Annotations that have been added to the analysis can be shown in the report as well.
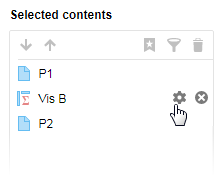
Typically, each item in the Selected contents pane is a page of its own in the PDF document. However, for an individual visualization that has been added to the report, it is possible to make modifications to the output. What you can do depends on the type of the visualization. For example, if the visualization content is not fully visible in the analysis (this might be the case for trellised and tabular visualizations), you can specify to include also those non-visible parts in the report.
To access the modification options, you move the cursor
over the added visualization, and click  . The various
options are described in Export
a visualization and include non-visible content.
. The various
options are described in Export
a visualization and include non-visible content.
It is possible to include different views of the analysis in the report without having to create each of the them manually. The differences in the views can be based on bookmarks that have been applied, or based on filtering to selected filter values. By repeating pages and visualizations over bookmarks or filter values, you are able to mirror certain analysis interactivity in the report.
In the Selected contents pane, you specify which pages and visualizations you want to repeat the bookmarks or filter values over. What to repeat is gathered into framed sections. The export will then automatically return the different views of the analysis.
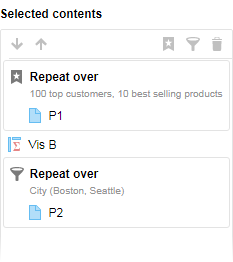
Note: Analysis pages and visualizations that are not included in any frame are not repeated.
Export Different Views of an Analysis Using Bookmarks
Assume you have found certain interesting analysis states and captured them in different bookmarks. You want to create a report that shows the pages and visualizations in these different states. Instead of manually applying each bookmark and exporting once for each applied bookmark, you can in a report apply the bookmarks to the pages in one single operation. You select which parts of the analysis you want different views of, followed by which bookmarks you want to apply, and the export will automatically be repeated over these bookmarks. See 'To repeat pages and visualizations over bookmarks'.
Export Different Views of an Analysis Using Filters
Perhaps you have an analysis with sales data for the 'Regions' West, East, North, and South, and you want to create a report that shows sales for only one region at a time. Instead of manually adjusting the 'Regions' filter and exporting once for West, once for East, and so on, you can make the export in one single operation. You select which parts of the analysis you want different views of, followed by which regions you are interested in, and the export will automatically be repeated over these regions, filtering to one region at a time. See 'To repeat pages and visualizations over filter values'.
Nested Sections
More advanced repetitions can be achieved by creating repeating sections within other repeating sections. This can be useful if you, for example, want a hierarchically structured report.
To exemplify, assume your data (in addition to 'Regions' mentioned above) also contains 'Cities' such as Seattle, Los Angeles, Boston, and so on. Then you can, by nesting sections that repeat over filter values, get PDF pages that show combinations of categories like "West, Seattle", "West, Los Angeles", "East, Boston", and so on.
