
Option |
Description |
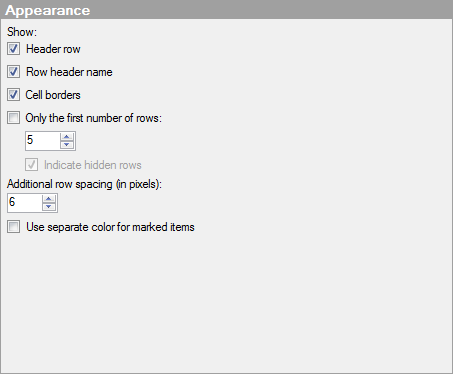
Show |
|
Header row |
Specifies whether or not the column headers at the top of the graphical table should be visible. Tip: If you want to show or hide a specific column header, instead of the entire row of headers, open the Settings dialog for the column of interest, go to the General page and then select or clear the check box Show name in header. |
Row header name |
Specifies whether or not the row header name should be visible. This is the left-most header in the header row, displayed above the column containing the row headers in the graphical table. By default, the row header name is the name of the column on the row axis. If the row axis has a hierarchy of columns, then the row header name is the column at the lowest level in the hierarchy. |
Cell
borders |
Specifies whether or not cell borders should be visible in the graphical table. |
Only the first number of rows |
Select this check box if you want to display a limited number of rows in the graphical table. Note that the sort order in the graphical table affects which rows are shown. |
Indicate
hidden rows |
Select this check box if you want to get an indication that some rows in the graphical table are not displayed when the Only the first n rows check box has been selected. A row with three dots in each cell will be added to indicate this. |
Additional row spacing (in pixels) |
Specifies how many extra pixels should be added to each row. Note: The row heights are automatically increased if the font size is increased. The Additional row spacing setting only needs adjustment if you want to add a few more pixels between the rows. Tip: You can change the height of the rows directly in the visualization by clicking and dragging any divider between two rows to the desired height. |
Use
separate color for marked items |
Select this check box to use the specified marking color to distinguish marked items in this visualization. If the check box is cleared, then unmarked items will be faded out instead, and the original color will be kept for the marked items. See Marking in Visualizations for more information. |