Option |
Description |
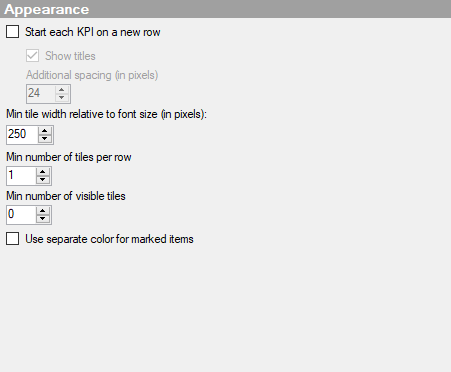
Start each KPI on a new row
|
Select this check box to start each KPI on a new row. This can be useful when the different KPIs have similar colors and you want to better distinguish them visually. |
Show titles
|
Select this check box to show the title of each KPI. |
Additional spacing (in pixels)
|
Select this check box if you want to adjust the number of pixels that should be added between the KPIs. Note: If the visualization is resized and scaled down due to what has been set in Min number of tiles per row and Min number of visible tiles, the spacing is also adjusted relatively and does no longer reflect the exact number of pixels specified here. |
Min
tile width relative to font size (in pixels) |
Specifies the minimum tile width in the grid of tiles in the KPI chart. The minimum tile width is relative to the font size. If you change the font size, the tile width is automatically increased or decreased by the same multiple as the font size. For example, when you increase the font size from 9 to 18, the tile width doubles automatically. The value specified in here however, stays the same. This value only reflects the tile width as the actual number of pixels, when the font size is set to Default. If the visualization is resized and the tile width falls below the number specified here, tiles will be moved to the next row. If they cannot be moved to the next row or must remain visible due to what has been set in Min number of tiles per row and Min number of visible tiles, they will be scaled down while keeping the ratio between the tile width and the font size. Important: It is recommended that you set the font size first before you set the minimum tile width. |
Min number of tiles per row |
Specifies how many tiles remain in one row when the visualization is resized. Important: This setting and Min tile width relative to font size (in pixels) are linked. It is recommended that you set the font size and the minimum tile width first, before you specify Min number of tiles per row and Min number of visible tiles. |
Min number of visible tiles |
Specifies how many tiles remain visible without having to scroll when the visualization is resized. Important: This setting and Min tile width relative to font size (in pixels) are linked. It is recommended that you set the font size and the minimum tile width first, before you specify Min number of tiles per row and Min number of visible tiles. |
Use
separate color for marked items |
Select this check box to use the specified marking color to distinguish marked items in this visualization. If the check box is cleared, then unmarked items will be faded out instead, and the original color will be kept for the marked items. See Marking in Visualizations for more information. |