Click the plus sign next to the existing pages.
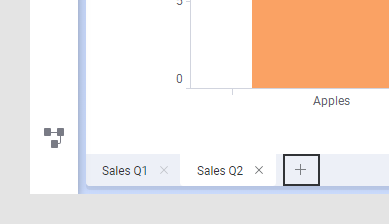
Comment: You can also select Visualizations > New page from the menu bar.
You can work with several pages in your analysis if you want to keep information separated, or if you simply need more space. On each page, you can insert one or many visualizations, and arrange these as you like. Perhaps you want to see both a table and a bar chart next to each other on one page to compare details, and then be able to switch pages to see a pie chart.
The pages are found either in the lower left, or upper left, of the analysis. Navigation between pages can be done using three different modes; titled tabs, step-by-step, or history arrows, as described below.
Alternatively you can use various controls in text areas to handle the navigation workflow through an analysis. Then the page navigation can be turned off.
Tip: It is possible to open the pages in an analysis in different windows of your browser. For details, see Viewing Analysis Pages Simultaneously.
To add a new page to the analysis:
Click the plus sign next to the existing pages.
Comment: You can also select Visualizations > New page from the menu bar.
Note: New pages can only be added in titled tab mode.
Comment: When a new page is added, the filtering scheme and organize filters settings are inherited from the active page.
To switch between top and bottom placement of page navigation:
You can select whether page navigation should appear above or below the visualizations in the analysis.
Right-click the area containing the tabs, links, or history arrows.
Select Page Navigation > Show Page Navigation at the Top from the pop-up menu.
Tip: When moving the page navigation from bottom to top or vice versa, you might also want to move the status bar. Just right-click the area containing the page navigation, and then select Page Navigation > Show Status Bar at the Top from the pop-up menu.
To change the page navigation mode:
Right-click the area containing the tabs, links, or history arrows.
Select Page Navigation > Titled tabs, Step-by-Step, History Arrows or Off from the pop-up menu.
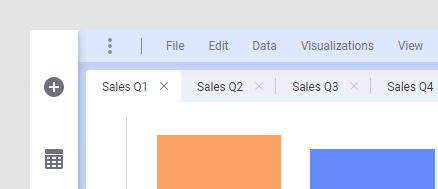
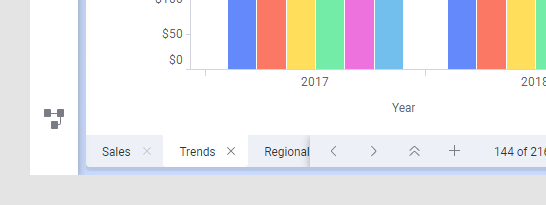
Titled Tabs
In the Titled tab mode, the pages are indicated by titled tabs at the bottom or top of the analysis, and you click these tabs to switch pages. The Titled tab mode is useful when you want to see the titles of the pages in the analysis and choose in what order to look at the pages.
In case the analysis contains too many tabs to be visible all at the same time, the double arrow is shown to the left of the plus sign. Click the double arrow to open a drop-down list, where you can switch between all the pages in the analysis. You can also use the left and right arrow to scroll horizontally through the tabs and you can change the order of your pages using drag-and-drop.
Right-click a page tab.
Select Rename Page from the pop-up menu.
Type a new name for the page.
Click OK.
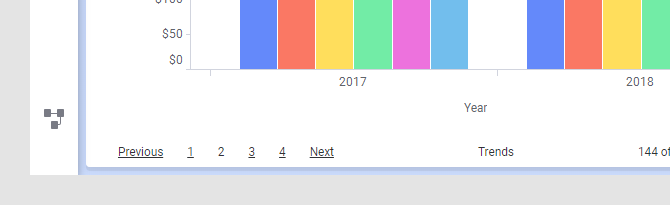
You can also select to show the pages as numeric links instead of tabs. The pages are now reached by clicking the numbered links or the Previous/Next links. The Step-by-Step mode is useful when the order of the pages is important and you want to present your analysis as a guided flow.
See also Guided Analyses.
It is possible to navigate through an analysis using various action controls in text areas and certain visualizations like graphical tables and KPI charts. Action controls can be, for example, buttons or links that are added to lead the user to the analysis pages in a specific order. Using this way to navigate, the option History arrows might be suitable to use.
In this mode, the user will not be able to select pages as in the Titled tabs and Step-by-step modes. The page history arrows next to the page title makes it possible, though, to return to a previously visited page.
When you select the Off option, the navigation modes are turned off meaning that no tabs, links, or arrows are available. Hence, the Off option requires that the analysis workflow is handled using actions controls as in the History arrows mode. The only difference is that the historical navigation to previously visited pages is not provided. You get a cleaner look, which might be beneficial when, for example, there is only one page in the analysis, or you want less cluttered dashboards.
Adapting page layout to different screen sizes
You have different options to determine the size of the area where the visualizations are shown to prepare the analysis for different platforms. For more information, see Layout Options and To specify a particular visualization area size.
Filtering in different pages
You can specify whether or not filtering on one page will affect the visualizations on a different page by using the same or different filtering schemes on the pages. You can also specify which filters will be visible on each page using the Organize Filters dialog. The filtering scheme of new pages is inherited from the active page, but it can be changed by displaying the filtering scheme menu in the Filters panel.
Showing and hiding panels
The visibility of all panels such as the filters panel, and the bookmarks panel is controlled per page. For each page, you can switch on or off the panels of interest by clicking their corresponding toolbar button (and clicking Dock if the panel is in popover mode) or by selecting it from the View menu. The panel visibility of new pages is inherited from the active page.