|
Option |
Description |
|
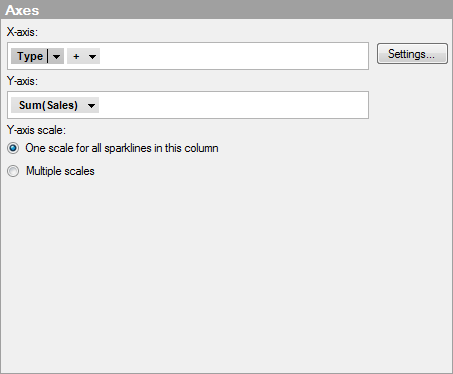
X-axis |
Specifies the column or hierarchy to be displayed on the X-axis. |
|
Settings... |
Opens the Advanced Settings dialog, where you can change the scale mode from categorical to continuous, and vice versa, as well as changing the category mode to determine which combinations to show. |
|
Y-axis |
Specifies the column or hierarchy to be displayed on the Y-axis. |
|
Y-axis scale |
[Only applicable when the sparkline is part of a graphical table.] |
|
One scale for all sparklines in this column |
Use this option if you want to show the Y-axis values for all sparklines in the graphical table presented using the same scale. |
|
Multiple scales
|
Use this option to show the Y-axis values for all sparklines using different scales. For example, use it if the data for several categories are of very different magnitudes, and you are interested in seeing the trends for each category rather than how the curves behave relative to each other. |
See also: