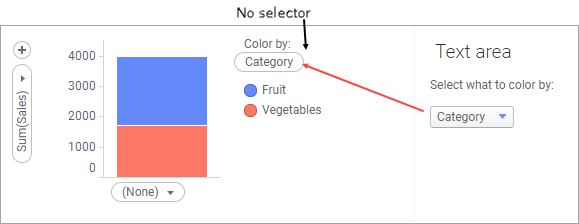
In the bar charts below, the column to color the bar chart by is selected from the text area rather than being configured on the Color by selector in the visualization. The text area contains a property control, here in form of a drop-down list, where a dashboard user can choose which column to color the bar chart by. The ordinary Color by selector is no longer available in the bar chart.
To handle column selection from a text area, do as follows:
First, insert the property control into the text area.
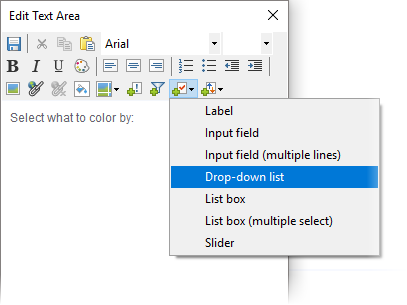
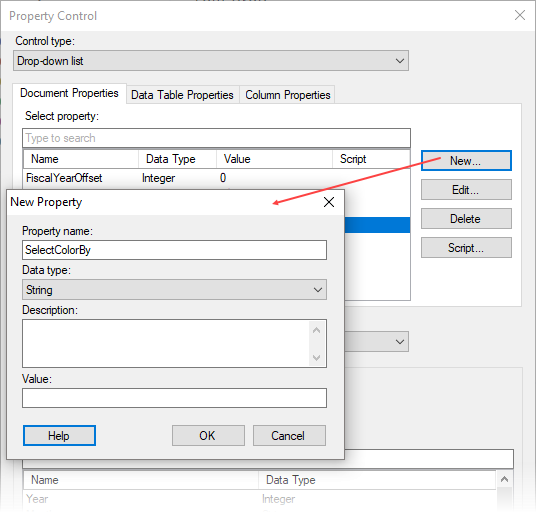
This opens the Property Control dialog, where the items that should be available for selection in the drop-down list are defined. However, the actual property to be controlled does not yet exist. To create it, click New to open the New Property dialog, where you give the property a name and specify its data type.
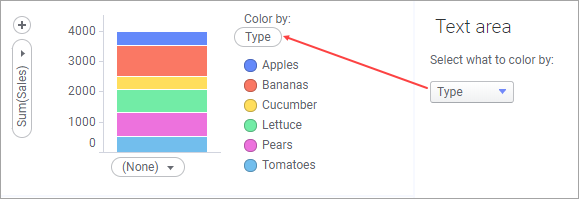
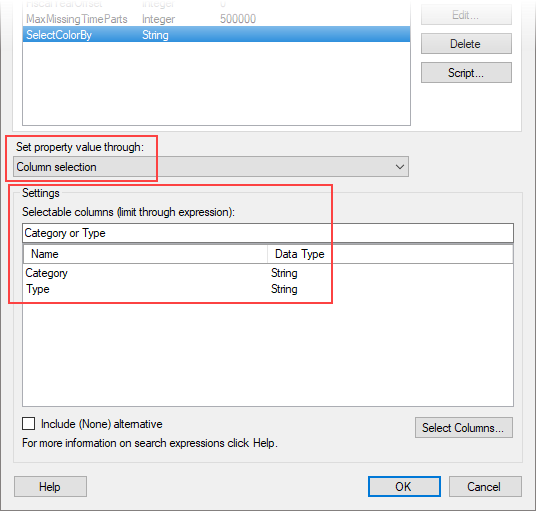
Now that the property exists, define the values the property should be able to assume. In this example, the value of the property is either 'Category' or 'Type', as you want to color the bar chart by either of these columns. The settings are made at the bottom of the Property Control dialog. The property values are set through Column selection, and an 'or' expression is used to define the two columns to include.
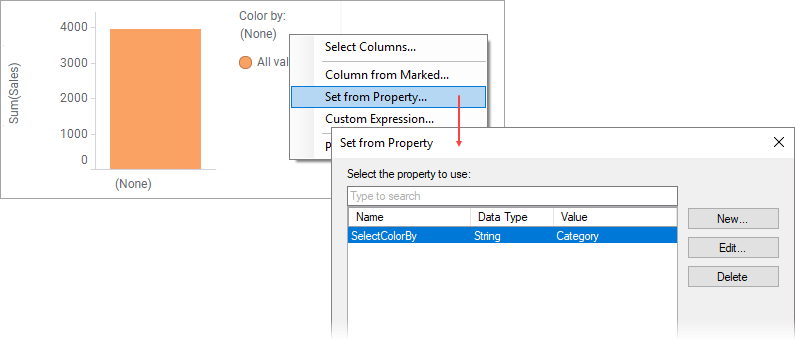
The last step is to connect the property to the place that should react on the selected property value, in this case the Color by selector in the bar chart. Right-click the selector, choose Set from Property, and select the new property.
Now, everything is ready for switching the column to color by from the text area.
Note: If you want to switch to the selected column also on other axes in the visualizations simultaneously, simply hook the property to these places as well.
See also: