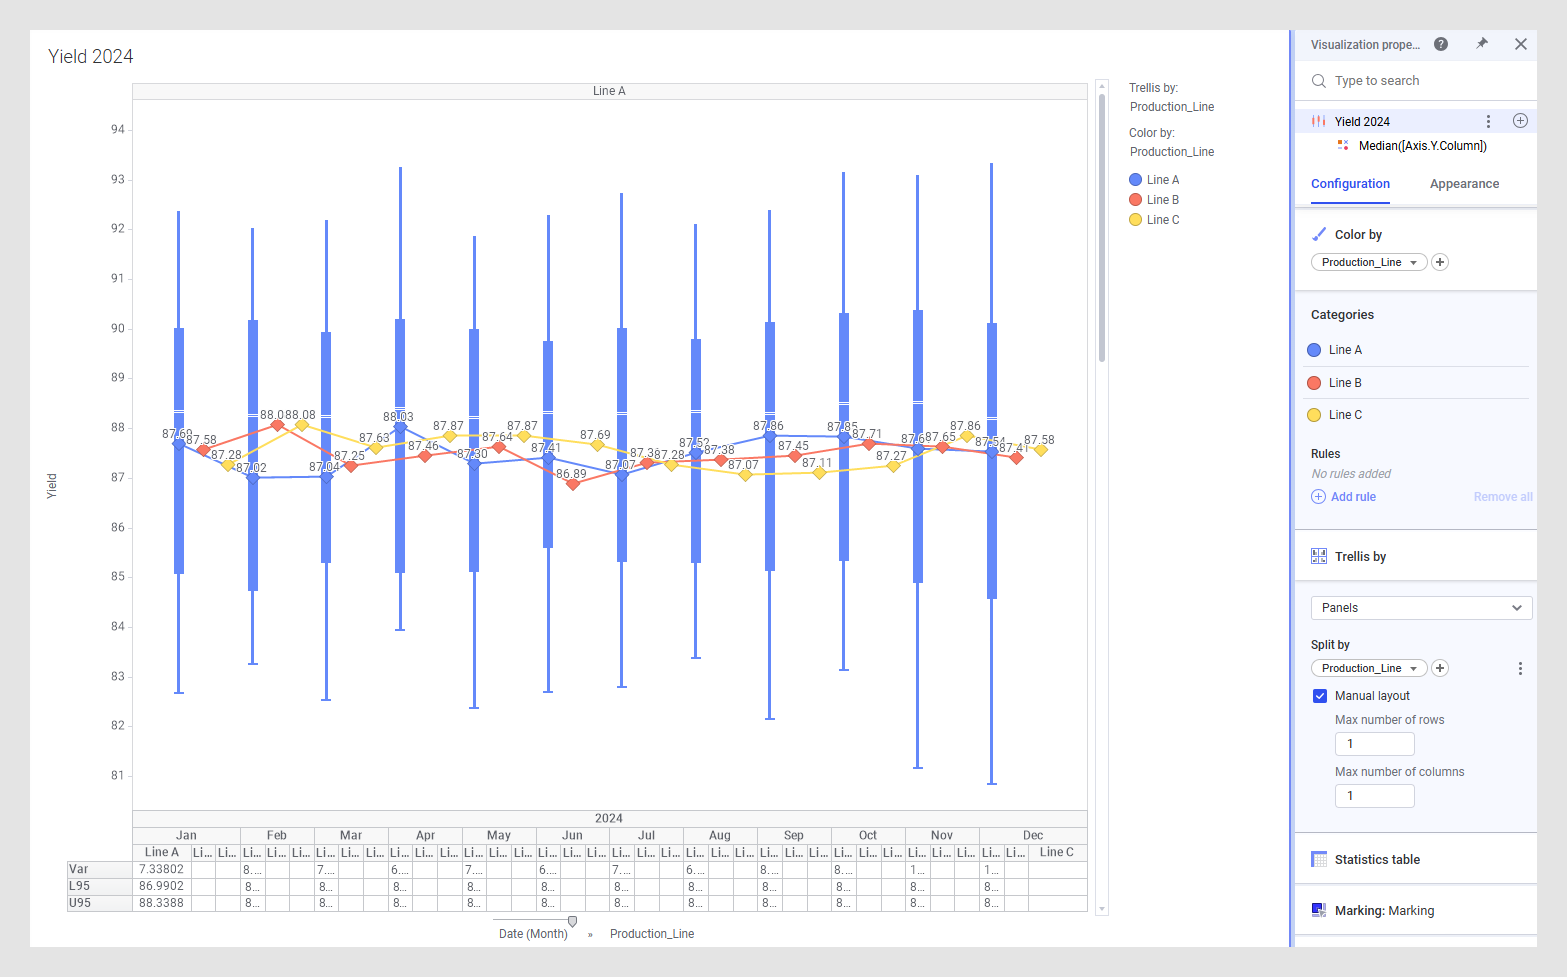
Using reference elements to show trend lines - example
You can use reference elements and line connections to show trends over time.
In a production environment, a production or yield engineer wants to understand yield drift over time across production lines by observing whether a metric (for example, median or mean) is trending up or down. In Spotfire, they can create trend lines by using reference elements and line connections to gain these insights about their data.

Configure a box plot to show Date(Month) on the category axis and Yield on the value axis. Make sure that the box plot is not sorted. For more clarity, you can remove Histogram, Confidence interval (95%), and Comparison circles.
Add a
Reference layer to the box plot. Remove the
Line that is automatically added, add a
Marker , and configure
Value to be
Median([Axis.Y.Column]), which refers to the median of
the column that is selected on the Y-axis. If you want, adjust the marker size.
Add Labels to your markers. Adjust the vertical text alignment and the font settings for better readability.
Add a Line connection to see trends across all production lines over the year.

Add Production_Line to the category axis and apply Color by Production_Line both to the box plot and the reference layer to show trends over the year for each production line.

Add Trellis by to only the box plot and not the reference layer. Select Production_Line under Pages to examine one production line at a time. In this way it is easier to see and evaluate the trends for each production line and still be able to compare it to the trends of the other production lines.