Box Plot
Visualizes the attributes of a data set in box plot format.

Information at a Glance
|
Parameter |
Description |
|---|---|
| Category | Explore |
| Data source type | DB, HD |
| Send output to other operators | No |
| Data processing tool | Pig |
Use this operator to create a graphical representation of a data set's attributes using the box-and-whisker diagrams.
For each box-and-whisker, the following applies.
- The bottom and top of the box indicate the 25th and 75th percentile of the data.
- The band in the middle of the box indicates the 50th percentile (median).
- The bottom and top of the whisker represents the minimum and maximum within the data set.
- The mean is denoted by a small circle.
The Box Plot operator allows you to choose the following three attributes (columns) in the data table:
- X dimension (Analysis Type) - Accepts a category-type attribute to construct the box plot's X-axis.
- Y dimension (Analysis Value) - Accepts a numerical attribute to construct the box plot's Y-axis.
- Grouped dimension (Analysis Series) - Accepts a category-type attribute, which is shown in diagrams of different colors.
Input
A data set from the preceding operator.
Configuration
| Parameter | Description |
|---|---|
| Notes | Notes or helpful information about this operator's parameter settings. When you enter content in the Notes field, a yellow asterisk appears on the operator. |
| Analysis Series | The categorical column for the groups. |
| Analysis Type (X-axis) | The categorical column for the X-axis. |
| Analysis Value (Y-axis) | The numerical column for the Y-axis. |
| Use approximation (faster) | Specify whether to use approximation - Yes (the default) or No. |
Output
Example
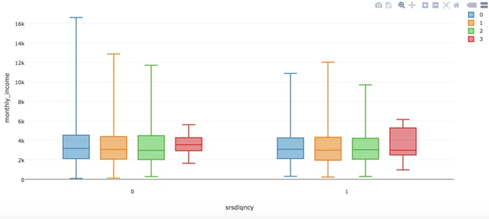
The following example shows monthly income (Analysis Value) for delinquent/non-delinquent credit customers (AnalysisType) grouped by the Number of Times 90 Days Late (Analysis Series).