Gradient-Boosted Tree Classification
This operator implements the Gradient-Boosted Tree Classification algorithm from Spark ML.

Information at a Glance
|
Parameter |
Description |
|---|---|
| Category | Model |
| Data source type | TIBCO® Data Virtualization |
| Send output to other operators | Yes |
| Data processing tool | TIBCO® DV, Apache Spark 3.2 or later |
Algorithm
The Gradient-Boosted Tree algorithm is a predictive method, by which a series of shallow decision trees incrementally reduces prediction errors of previous trees. This operator implements the Gradient-Boosted Tree Classification algorithm from Spark MLlib.
Input
An input is a single tabular data set.
Bad or Missing Values
- Null values are not allowed and result in an error.
-
The Max Bins parameter should be increased to the maximum cardinality of categorical features. However, depending on the available resources, the system might not be able to handle very high values result in an error.
-
If the number of levels in the dependent column is not equal to 2, an error is reported.
Configuration
Users can fine-tune the hyper-parameters of interest with the cross-validation training method and use the specified metric to evaluate the performance. The following table includes the configuration details for the Gradient-Boosted Tree Classification operator.
| Parameter | Description |
|---|---|
| Notes | Notes or helpful information about this operator's parameter settings. When you enter content in the Notes field, a yellow asterisk appears on the operator. |
| Dependent Variable | Specify the categorical data column as a dependent column. |
| Use all available columns as Predictors | When set to Yes, the operator uses all the available columns as predictors and ignores the Continuous Predictors and Categorical Predictors parameters. When set to No, the user must select at least one of the Continuous or Categorical Predictors. |
| Continuous Predictors |
Specify the numerical data columns as independent columns. It must be numerical column. Click Select Columns to select the required columns. Note:
The columns selected in the Categorical Predictors parameter are not available. |
| Categorical Predictors |
Specify the categorical data columns as independent columns. Note:
The columns selected in the Continuous Predictors parameter are not available. |
| Evaluation Metric |
The metric for evaluating model performance during cross-validation training. For more information, see the Spark documentation on multinomial logistic regression. The following values are available:
If Auto, then the operator uses Accuracy. Note: The value of the beta parameter for FMeasure is set to 1.
Default: Auto |
| Number of Trees | A string specifying the number of trees. The input for this parameter should be a comma-separated sequence of integer values (for example, 10, 100.)
Default: 100. |
| Number of Feature Functions |
A function to determine the number of features for building each decision tree. The following values are available:
Default: Square-Root |
| Feature Sampling Ratio | The fraction of the number of features per node to use when the Number of Feature Functions is set to User Defined. The input for this parameter should be a comma-separated sequence of double values in (0,1).
Default: 0.5, 0.7. |
| Max Depth | The maximum depth of each tree. The input for this parameter should be a comma-separated sequence of integer values. Default: 3, 5. |
| Row Sampling Ratio | The fraction of training data for building each decision tree. The input for this parameter should be a comma-separated sequence of double values in (0,1).
Default: 1 |
| Min Leaf Size |
The smallest number of data instances that exist within a terminal leaf node of a decision tree. The input for this parameter should be a comma-separated sequence of integer values (for example, 1,2). Default: 1 |
| Max Bins |
The maximum number of bins used for discretizing and splitting continuous features. The input for this parameter should be a comma-separated sequence of integer values (for example, 256). The number of Max Bins should be larger than the number of unique levels of any selected categorical columns. Default: 32 |
| Learning Rate | The shrinkage parameter to control the contribution of each estimator. The input for this parameter should be a comma-separated sequence of double values in the interval (0,1). Default: 0.1 |
| Number of Cross Validation Folds | The number of cross-validation samples.
Default: 3 |
| Random Seed | The seed used for the pseudo-random row extraction.
Default: 1 |
Output
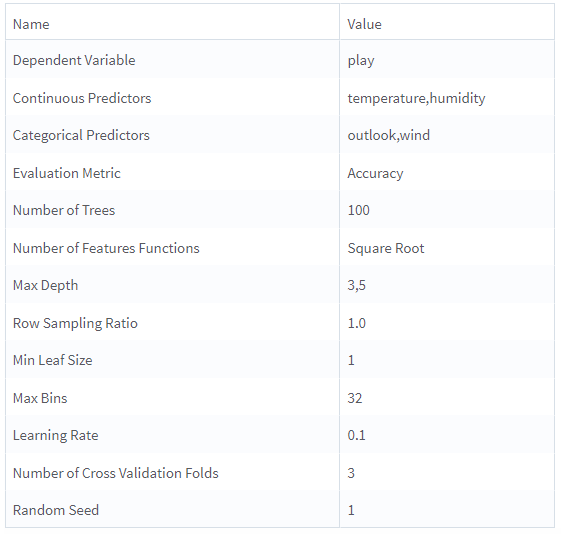
- Parameter Summary Info: Displays information about the input parameters and their current settings.
-
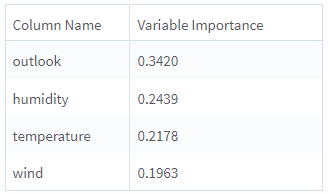
Variable Importance: Displays the importance of predictors as evaluated in the training process. For each predictor, the importance of the model is shown in the second column.
-
Training Summary: Displays a table with a row for each tested combination of hyper-parameters. For each hyper-parameter, the chosen metric is displayed and the Best Model is marked.
A model object that can be used with a Goodness of Fit operator and Confusion Matrix operator.
Example
The following example illustrates the Gradient-Boosted Classification operator.

Data
golf: This data set contains the following information:
- Multiple columns namely outlook, temperature, wind, humidity, and play.
- Multiple rows (14 rows).
Parameter Setting
The parameter settings for the golf data set are as follows:
-
Dependent Variable: play
-
Use all available columns as Predictors: Yes
-
Evaluation Metric: Auto
-
Number of Trees: 100
-
Number of Features Function: Square Root
-
Feature Sampling Ratio: 0.5, 0.7
-
Max Depth: 3, 5
- Row Sampling Ratio: 1
- Min Leaf Size: 1
- Max Bins: 32
- Learning Rate: 0.1
- Number of Cross Validation Folds: 3
- Random Seed: 1
These figures displays the results for the parameter settings for the golf data set.
Parameter Summary Info

Variable Importance

Training Summary
