Histogram
Analyzes the values of the selected fields of a data set, and generates a graphical representation of the frequency distribution of the numeric data.

Information at a Glance
|
Parameter |
Description |
|---|---|
| Category | Explore |
| Data source type | DB, HD |
| Send output to other operators | No |
| Data processing tool | Pig |
Algorithm
Histogram analysis calculates data frequency for a specific column.
For each column specified, users input either the number of bins to generate or the width of the bins. A bin is an interval that is divided equally between minimum and maximum value or by the width.
For example, a specific column's minimum value is 0 and maximum value is 100. If the user specifies five bins, each bin covers 20 units. If 10 bins are specified, each bin covers 10 units.
Bounds of each bin are defined as (Minimum, Maximum].
Input
A data set from the preceding operator.
Configuration
| Parameter | Description |
|---|---|
| Notes | Notes or helpful information about this operator's parameter settings. When you enter content in the Notes field, a yellow asterisk appears on the operator. |
| Bins | Select Bin Configuration to choose the available columns from the input data set for analysis. |
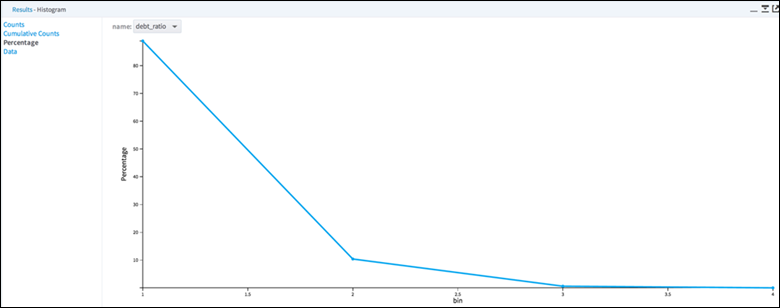
Output
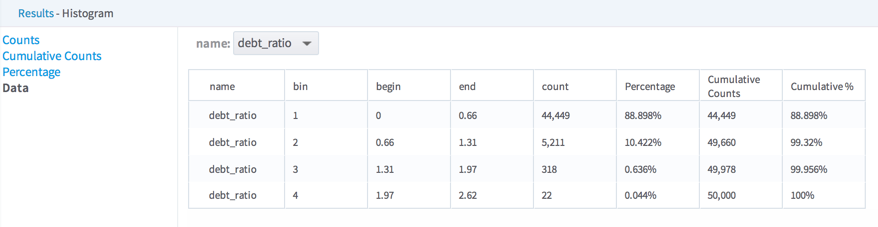
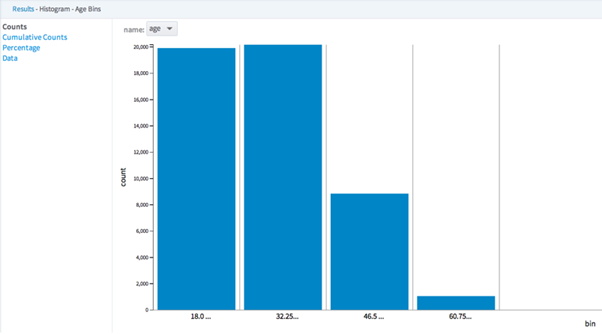
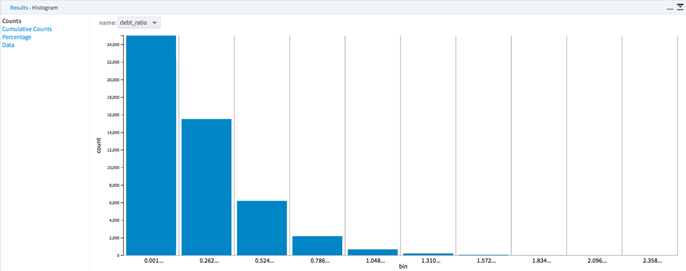
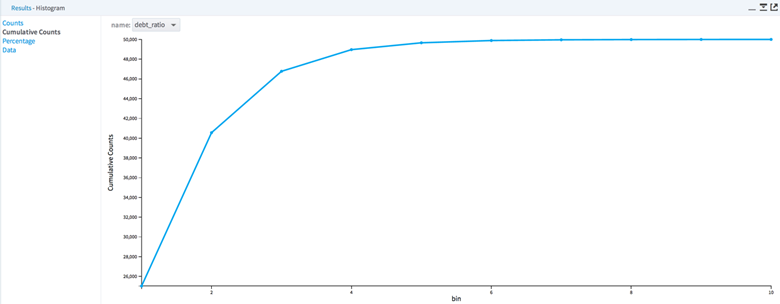
Four sections are displayed: Counts, Cumulative Counts, Percentage, and Data.
Summarizes information about each histogram, with numerical measures for:
- Bin name
- Bin number
- Bin start point
- Bin end point
- Count
- Percentage
- Cumulative counts
- Cumulative %