Normalization
This operator performs normalization on the selected columns of the input data set. Normalization means adjusting values measured on different scales to a notionally common scale.
![]()
Information at a Glance
|
Parameter |
Description |
|---|---|
| Category | Transform |
| Data source type | TIBCO® Data Virtualization |
| Send output to other operators | Yes |
| Data processing tool | TIBCO® DV, Apache Spark 3.2 or later |
Algorithm
You can accomplish normalization in the following ways:
- By specifying a user-defined minimum and maximum value.
- By a z-transformation (for example, on mean 0 and variance 1).
- By a transformation as a proportion of the average or sum of the respective attribute.
Your selection translates into four possible types of normalization:
- Z-Transformation.
- Proportion Transformation.
- Range Transformation.
- Divide-By-Average Transformation.
Input
An input is a single tabular data set.
Bad or Missing Values
Null values are not allowed and result in an error.
Configuration
The following table provides the configuration details for the Normalization operator.
| Parameter | Description |
|---|---|
| Notes | Notes or helpful information about this operator's parameter settings. When you enter content in the Notes field, a yellow asterisk appears on the operator. |
| Method | Specify the normalization method to use.
The following values are available:
|
| Range Minimum | Specify the minimum value in Range transformation. |
| Range Maximum | Specify the maximum value in Range transformation. |
| Columns | Specify the columns to normalize by selecting the available numerical columns. Click Column Names to open the dialog for selecting the available numerical columns. |
| Output Schema | Specify the schema for the output table or view. |
| Output Table | Specify the table path and name where the output of the results is generated. By default, this is a unique table name based on your user ID, workflow ID, and operator. |
| Store Results | When set to Yes, the operator saves the results. If set to No, the operator does not save the results. |
Output
- Output: A table that displays the output of a data set for the normalized data.
Example
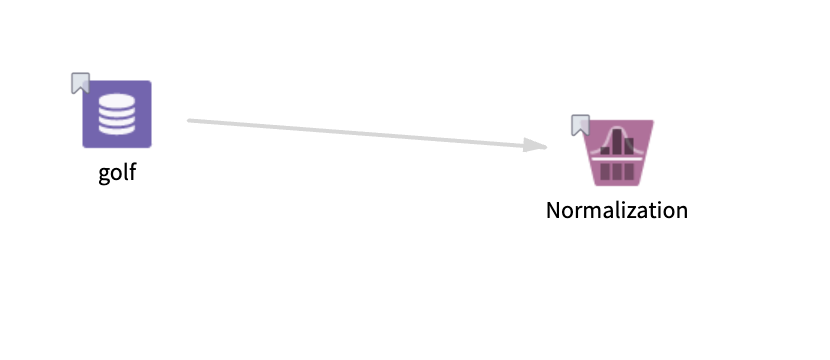
The following example displays the normalized data for the given data set using the Normalization operator.

golf: This data set contains the following information:
- Multiple columns namely outlook, temperature, wind, humidity, and play.
- Multiple rows (14 rows).
Parameter Setting
The parameter settings for the golf data set are as follows:
-
Method: Proportional Transformation
-
Columns: outlook, humidity, wind, play, temperature
-
Store Results: Yes
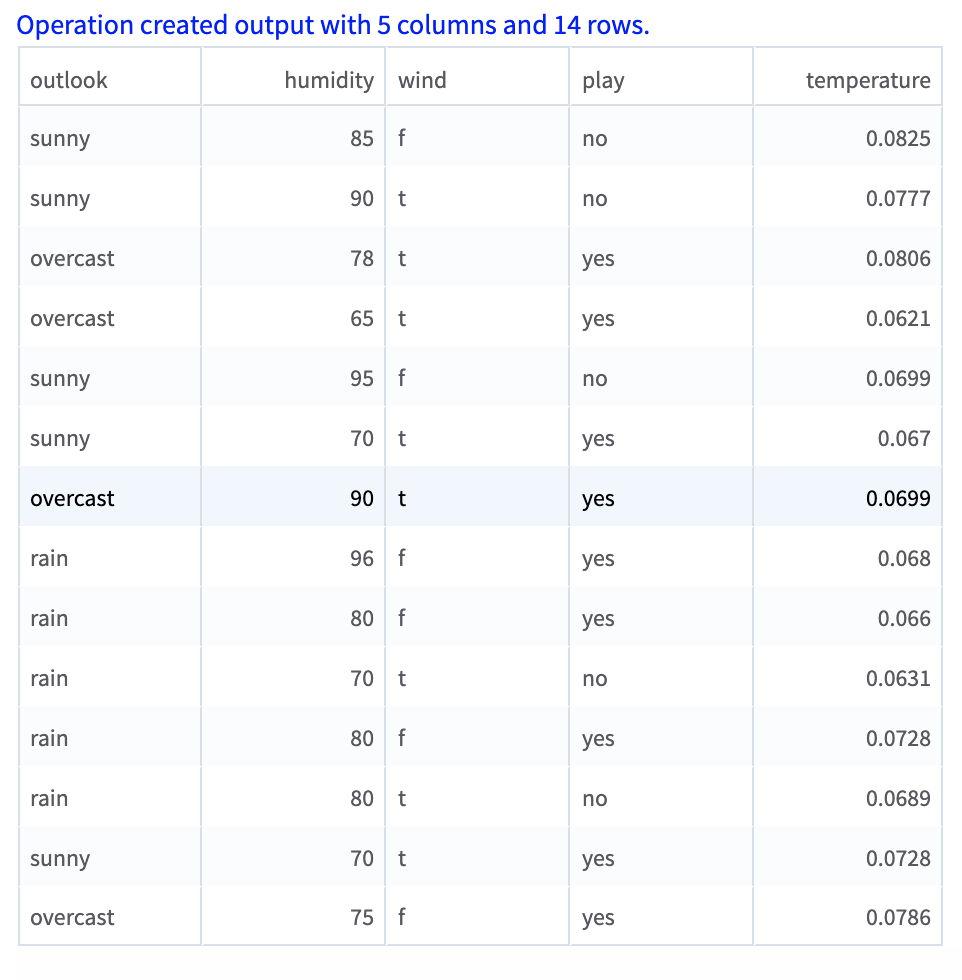
Output
The following figure displays the output for the parameter settings for the golf data set.
