Pivot (DB)
Lets you transform the categorical data contained in a column of a table into columns of a new table, by means of subtotals (or other calculations) that might be defined by another column in the same list. The other calculations might be averages and counts.

Information at a Glance
|
Parameter |
Description |
|---|---|
| Category | Transform |
| Data source type | DB |
| Send output to other operators | Yes |
| Data processing tool | n/a |
Algorithm
For typical data entry and storage, data usually appears in flat tables, meaning that it consists of only columns and rows. While such data can contain a lot of information, it can be difficult to get summarized information. A pivot table can help quickly summarize the flat data, giving it depth, and highlighting the desired information.
The usage of a pivot table is extremely broad and depends on the situation. The first question to ask is "What am I looking for?" A pivot table usually consists of row, column, and data (or fact) fields. These fields allow several kinds of aggregations including: sum, average, count, max, min, etc.
The Pivot Column is usually a categorical column, and in the output table it is transformed into multiple columns, one for each category.
- The results are also grouped by a selected column.
- The values in the new columns are aggregates of a third column (or of the presence of the category if no aggregate column is chosen).
- The columns are listed (in the table, file, or array) in descending order of the value of the category they represent.
Input
A data set from the preceding operator.
Configuration
| Parameter | Description |
|---|---|
| Notes | Notes or helpful information about this operator's parameter settings. When you enter content in the Notes field, a yellow asterisk appears on the operator. |
| Pivot Column | The column for pivot transformation. On database data sources, you can only choose categorical columns to pivot. |
| Group By | The column to group by. |
| Aggregate Column | The pivot column's value column. |
| Aggregation | The aggregate function. Options:
|
| Use Array | The format of the output.
Default value: false |
| Output Type |
|
| Output Schema | The schema for the output table or view. |
| Output Table | Specify the table path and name where the output of the results is generated. By default, this is a unique table name based on your user ID, workflow ID, and operator. |
| Storage Parameters | Advanced database settings for the operator output. Available only for
TABLE output.
See Storage Parameters dialog for more information. |
| Drop If Exists | Specifies whether to overwrite an existing table.
|
Output
The values in the array are arranged in descending order of the value of the category they represent.
If Use Array is false or if the operator is operating on a Hadoop data set, pivoted values are each placed in their own column.
If Use Array is true, a data set of the newly created table or view is output to the succeeding operator. Otherwise, no output is sent.
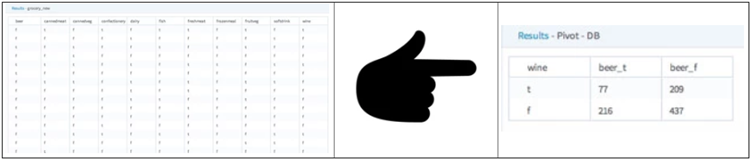
Example
The raw grocery data shown below can be quickly converted using the Pivot operator into a summary table of the count of beers sold when wine was or was not sold.