Scatter Plot Matrix
Creates pairwise scatter plots of the selected columns. This gives a visual sense of the relationship between each of the paired attributes, as well as the calculated correlation.

Information at a Glance
|
Parameter |
Description |
|---|---|
| Category | Explore |
| Data source type | DB, HD |
| Send output to other operators | No |
| Data processing tool | Pig |
Input
A data set from the preceding operator.
Configuration
| Parameter | Description |
|---|---|
| Notes | Notes or helpful information about this operator's parameter settings. When you enter content in the Notes field, a yellow asterisk appears on the operator. |
| Select Columns | Click to select the columns from the input data set.
Choose a set of numeric columns to view a scatter plot matrix. The matrix uses 200 data points as the default sample set to create the scatter plot. |
Output
Visual Output
A matrix of the generated scatter plots based on the various pairs of selected data columns (variables). The plotted points are selected randomly from the input data set. The correlations are computed based on the entire data set, not on the sample points.
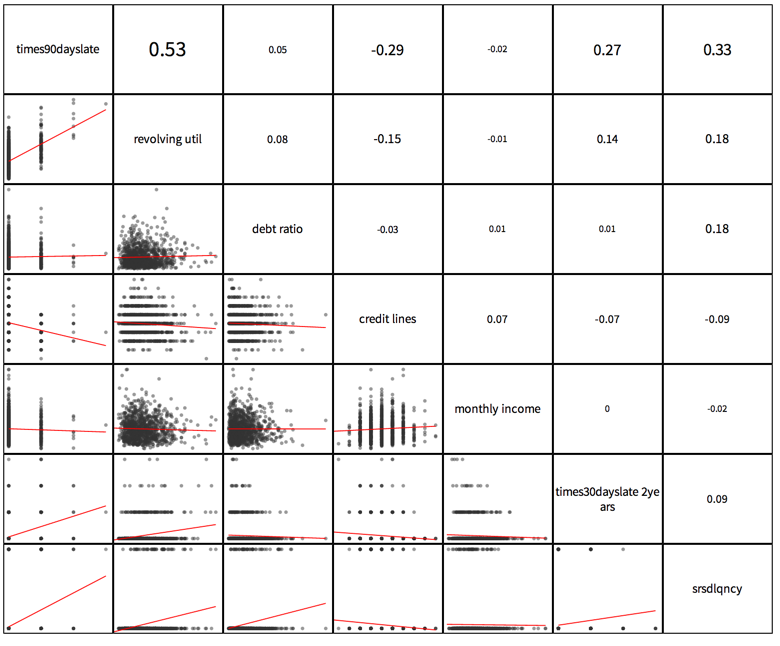
Double-click a small scatter plot to display a full size scatter plot.
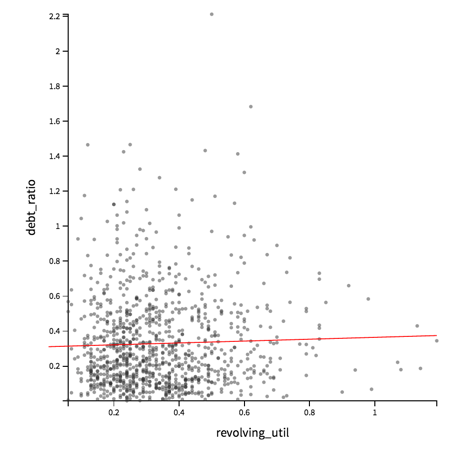
Note: For more information about the full-size scatter plot visualization, see
Explore Visual Results.
Data Output
None. This is a terminal operator.