T-Test - Paired Samples
Computes a test of statistical significance for two measures of the same data points. This is the same as computing a single sample t-test against the difference between the two columns and a known mean of zero.

Information at a Glance
|
Parameter |
Description |
|---|---|
| Category | Model Validation |
| Data source type | HD |
| Send output to other operators | Yes |
| Data processing tool | Spark |
The paired samples t-test is used to test whether two responses measured on the same statistical unit are significantly different. Mathematically, it is the same as running a single sample t-test on the delta of the two samples for each row against an assumed mean of 0.0.
For information about Student's t-distribution, see https://en.wikipedia.org/wiki/Student%27s_t-distribution
Algorithm
The means and variances for all of the test statistics are computed using Spark's MultivariateStatisticalSummary object, but the t-tests themselves are computed from Java's commons-math library.
Input
A tabular data set with numeric columns.
Configuration
| Parameter | Description |
|---|---|
| Notes | Notes or helpful information about this operator's parameter settings. When you enter content in the Notes field, a yellow asterisk appears on the operator. |
| First Column | The first measure to compute the t-test on. This must be a numeric column. |
| Second Column | The second measure to compute the t- test on. This must be a numeric column. |
| Write Rows Removed Due to Null Data To File | Rows with null values are removed from the analysis. This parameter allows you to specify that the data with null values be written to a file.
The file is written to the same directory as the rest of the output. The filename is suffixed with _baddata.
|
| Storage Format | Select the format in which to store the results. The storage format is determined by your type of operator.
Typical formats are Avro, CSV, TSV, or Parquet. |
| Compression | Select the type of compression for the output.
Available Parquet compression options.
Available Avro compression options.
|
| Output Directory | The location to store the output files. |
| Output Name | The name to contain the results. |
| Overwrite Output | Specifies whether to delete existing data at that path.
|
Output
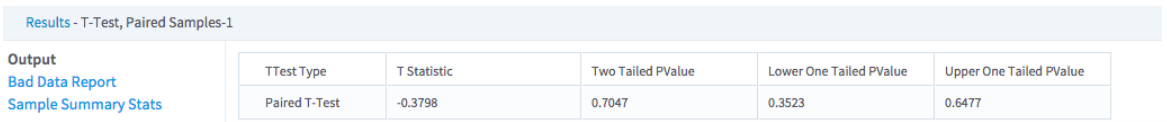
- T Statistic - A value computed based on the average and variance. The higher the magnitude of the t-statistic, the higher the difference between the means.
- Two Tailed PValue - The sum of the area under the Students t-distribution above the absolute value of the t-statistic and below the inverse of the t-statistic. A higher value indicates a greater absolute difference in the sample compared. We usually reject the null hypothesis if p < 0.05.
- Lower One Tailed PValue - The area under the Student's t-distribution between negative infinity and the t statistic. A lower p-value indicates that sample a is less than sample b. We usually reject the null hypothesis if p < 0.05.
- Upper One Tailed PValue - The area under the Student's t-distribution between positive infinity and the t statistic. A lower p-value indicates that sample a is greater than sample b. We usually reject the null hypothesis if p < 0.05.