Correlation
This operator is used to specify two or more numeric type attributes (columns) in a data set for relative analysis against each other by calculating the correlation between each pair of selected columns.

Information at a Glance
|
Parameter |
Description |
|---|---|
| Category | Explore |
| Data source type | TIBCO® Data Virtualization |
| Send output to other operators | Yes |
| Data processing tool | TIBCO® DV, Apache Spark 3.2 or later |
Algorithm
The covariance between two variables (X and Y) is calculated as given in the following formula:
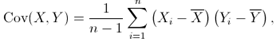
where
 and
and
 are the mean values for
X and
Y, respectively.
are the mean values for
X and
Y, respectively.
The correlation is calculated by normalizing the covariance, as given in the following formula:
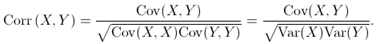
For information about correlation and covariance, and the algorithms that describe them, see Correlation and Covariance.
Input
An input is a single tabular data set.
Restrictions
The algorithm is relevant only for numeric data.
Configuration
The following table provides the configuration details for the Correlation operator.
| Parameter | Description |
|---|---|
| Notes | Notes or helpful information about this operator's parameter settings. When you enter content in the Notes field, a yellow asterisk appears on the operator. |
| Columns | Specify the numeric columns for which the correlation or covariance should be calculated. Click Select Columns to select the required columns.
Note: The input data set should not contain a column with the name Attribute or else it results in an error. |
| Group by | When you select one or more Group-by columns, the operator calculates a separate correlation (or covariance) matrix for every combination of values in the Group-by columns. You can select one or more columns. Click Select Columns to select the required columns. Note:
|
| Calculate | Specify whether to calculate the
Correlation or the
Covariance. Correlation is normalized covariance, scaled so that the correlation between any variable and a positive multiple of itself is always 1.
Default: Correlation |
| Output Schema | Specify the schema for the output table or view. |
| Output Table | Specify the table path and name where the output of the results is generated. By default, this is a unique table name based on your user ID, workflow ID, and operator. |
| Store Results | When set to Yes, the operator saves the results. If set to No, the operator does not save the results. |
Output
Example
The following example illustrates the Correlation operator.

- Multiple columns namely outlook, temperature, wind, humidity, and play.
- Multiple rows (14 rows).
-
Columns: temperature, humidity
-
Group By: outlook
-
Calculate: Covariance
-
Store Results: Yes
